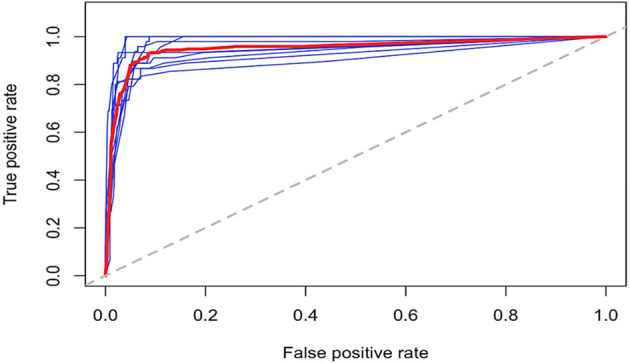
Figure 5.

Risk of death ROC curves for the tenfold cross-validation subsets. ROC curves for the tenfold training data used at the model-building step. Blue lines represent the ROC curves at each cross-validation fold, and the red bold line represent the average across all cross-validation folds.
