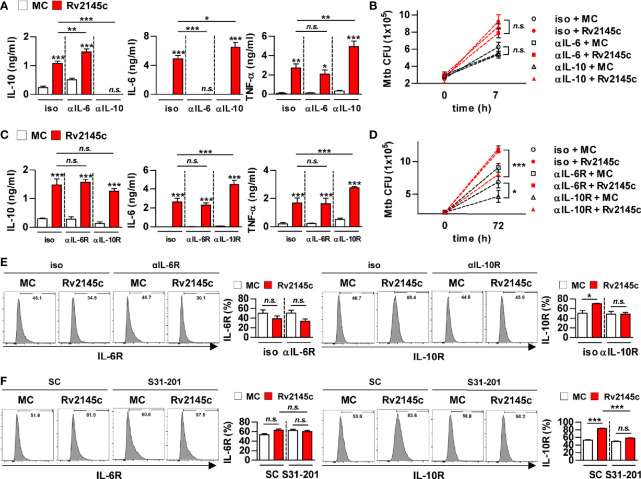
Figure 7.
Rv2145c enhances intracellular Mtb growth via IL-10 receptor signaling. (A-E) BMDMs were pretreated with anti-IL-6 (αIL-6, 5 μg/ml) antibody, anti-IL-10 (αIL-10, 5 μg/ml) antibody, mouse control IgG (iso, 5 μg/ml) for cytokine neutralization or anti-IL-6R (αIL-6R, 1 μM), anti-IL-10R (αIL-10R, 1 μM) or mouse control IgG (iso, 1 μM) for receptor blocking, and then BMDMs were infected with Mtb at an MOI of 1 for 4 and treated with 10 μg/ml Rv2145c. Then, the cells were cultured in the presence of each neutralizing antibody or receptor blocking antibody for 72 h. (A, C) IL-10, IL-6, and TNF-α levels in the culture supernatants were measured by ELISA. (B, D) Intracellular Mtb growth was determined by plating the cell lysates on 7H10 agar at 0 h and 72 h. (E) The expression of receptor markers was analyzed by two-color flow cytometry. The cells were gated to exclude F4/80+ cells. BMDMs were stained with anti-IL-6R or anti-IL-10R antibodies. (F) BMDMs pretreated with inhibitors of STAT3 (S31-201, 5 μM) for 1 h and then infected with Mtb at an MOI of 1 for 4 h and treated with 10 μg/ml Rv2145c, and then the cells were incubated in the presence and absence of S31-201 for 72 h. The expression of the receptor markers was analyzed by two-color flow cytometry. The cells were gated to exclude F4/80+ cells. BMDMs were stained with anti-IL-6R or anti-IL-10R antibodies. The bar graphs show the percentage (mean ± SD of three experiments) for each surface molecule on F4/80+ cells. *p < 0.05, **p < 0.01, and ***p < 0.001 for treatment compared with medium controls (MC) or for the difference between treatment data. n.s., no significant difference.

