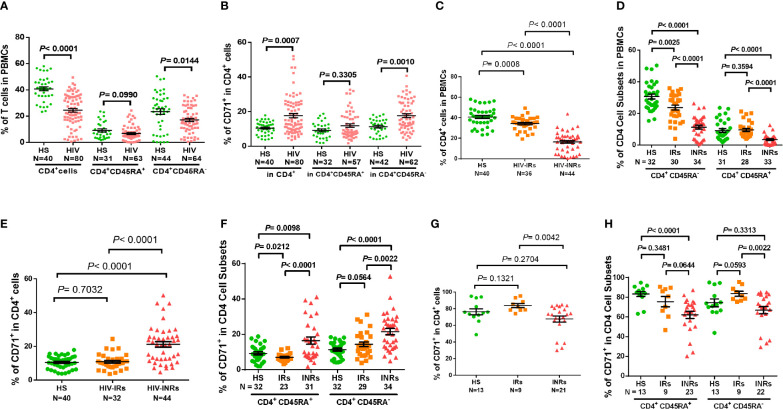
Figure 1.
CD4 T cell homeostasis in ART-controlled PLHIV and HS. (A, B) Flow cytometry analysis of frequencies (%) of CD4+ T cell subsets within PBMCs or CD71+ T cells within CD4+ T cells isolated from ART-controlled PLHIV and HS. (C) Percentages of CD4+ T cells within PBMCs isolated from HIV-INRs, HIV-IRs, and HS. (D) Percentages of CD4+CD45RA- and CD4+CD45RA+ cell subsets within PBMCs from HIV-INRs, HIV-IRs, and HS. (E, F) Flow cytometry analysis of CD71 expression in CD4+, CD4+CD45RA+, and CD4+CD45RA- cell subsets from HIV-INRs, HIV-IRs, and HS. (G, H) Flow cytometry analysis of CD71 expression in CD4+, CD4+CD45RA+ and CD4+CD45RA- cell subsets within PBMCs from HIV-INRs, HIV-IRs, and HS following in vitro TCR stimulation for 5 days.

