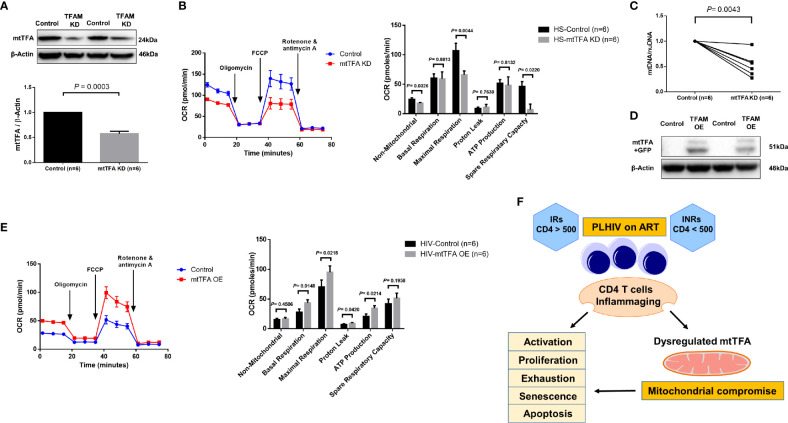
Figure 6.
TFAM Knockdown and Overexpression in CD4 T cells from PLHIV and HS. (A) Western blot analysis of mtTFA and β-actin expression in HS CD4 T cells with or without TFAM KD. (B) Representative OCR summary data for non-mitochondrial, basal respiration, maximal respiration, spare respiration capacity, proton leak, and ATP production in HS CD4 T cells with or without TFAM KD. (C) Genomic DNA was isolated to determine levels of mtDNA relative to nuDNA by qPCR. DNA content from mtTFA KD was normalized to the control group. KD = knockdown. (D) Western blot analysis of mtTFA and β-actin expression in PLHIV CD4 T cells with or without TFAM OE. (E) Representative OCR summary data in CD4 T cells from PLHIV following TFAM OE. OE = overexpression. (F) A model depicting the mechanisms and outcomes of CD4 T cell inflammaging in HIV latency.

