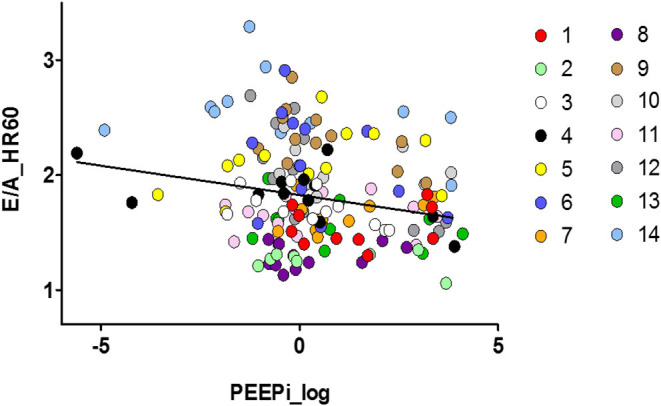
Figure 3.

Scatter plot of the association between left ventricular diastolic function and dynamic hyperinflation of the lungs. Individual observations (1–14) are color coded. E/A_HR60, ratio of transmitral E- to A-wave corrected for a heart rate of 60/min; PEEPi log, log transformed intrinsic positive end-expiratory pressure (cmH2O).
