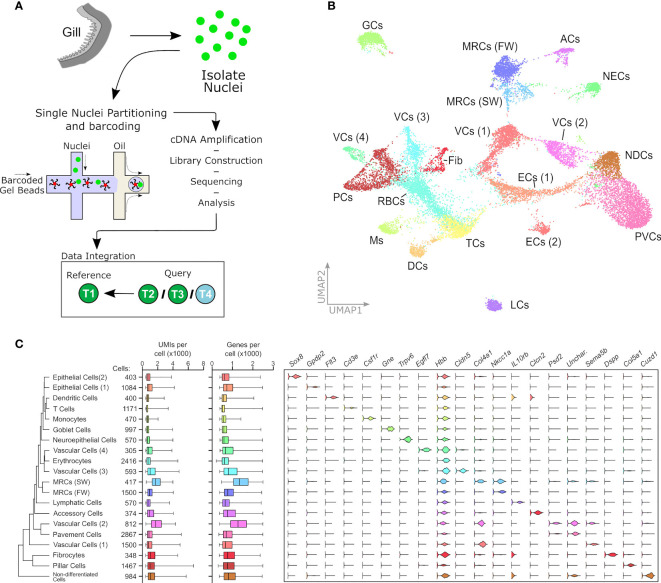
Figure 1.
Single nuclei RNAseq analysis of Atlantic salmon gill tissue. (A) Gill tissue processing. Pooled duplicates from all T2, T3 and T4 collection points are integrated against T1 as a reference set. (B) UMAP plot of pooled cell data from 18844 cells representing eight samples from four collection states. The plot indicates 20 separate cell clusters. (C) Expression of marker genes in 20 cell clusters. From left to right: hierarchical relatedness of difference cell clusters; total cells in each cluster; UMI number in each cell cluster; gene features in each cell cluster; violin plots showing expression pattern of marker genes for each cluster. ACs, accessory cells; DCs, dendritic cells; ECs, epithelial cells; fib, fibrocytes; GCs, goblet cells; LCs, lymphatic cells; Ms, monocytes; MRC, mitochondrion-rich cells; NDCs, non-differentiated cells; PVCs, pavement cells; RBCs, red blood cells (erythrocytes); TCs, T cells; VCs, vascular cells.

