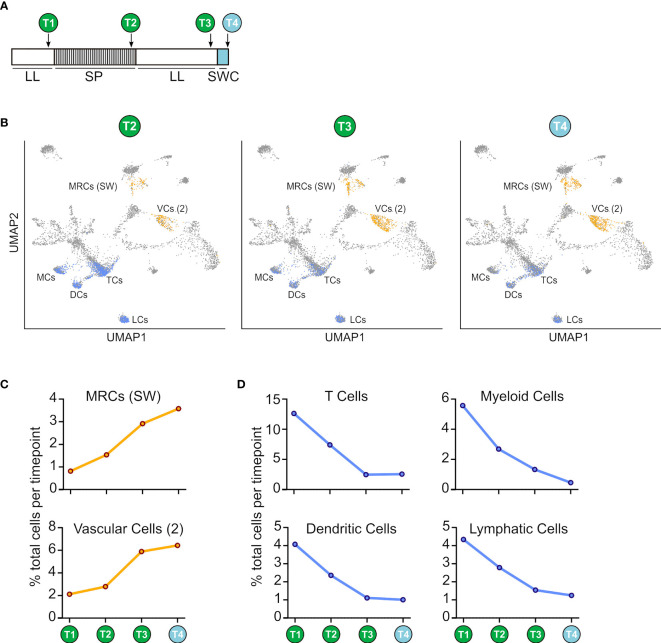
Figure 2.
Comparative abundance of cell clusters at different sampling points. (A) Experimental design. Fish were kept in constant light (LL) from hatching then transferred to short photoperiod (SP; 8L:16D) for 8 weeks before being returned to constant light (LL) for 8 weeks. Finally the fish were transferred to sea water for 24h. Sample points are indicated T1-T4. (B) Subset of cell clusters from T2, T3 or T4 (orange and blue dots) overlaid on T1 cells (grey dots). (C) Increasing abundance of sea-water mitochondrion-rich cells (MRCs SW) and vascular cells (VC 3) during smoltification (D) Decreasing abundance of leukocytes and immune-associated cells during smoltification.

