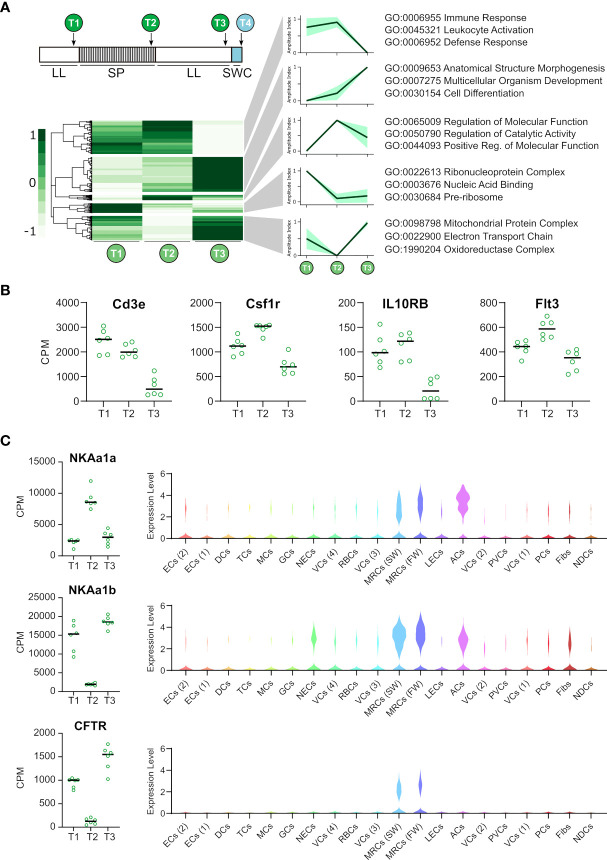
Figure 3.
Photoperiodic changes in gill gene expression and localized cell cluster expression. (A) Heat map representing 9746 genes differentially regulated (FDR <0.01) from T1-T3. Regulatory patterns for 5 major cluster are shown as amplitude index and 95% confidence limits. Major gene ontology terms for each cluster are shown. (B) RNAseq data for immune-associated genes differentially expressed by smoltification (FDR <0.01). (C) RNAseq data for “classical” smoltification-related genes and violin plots showing their cluster specific expression.

