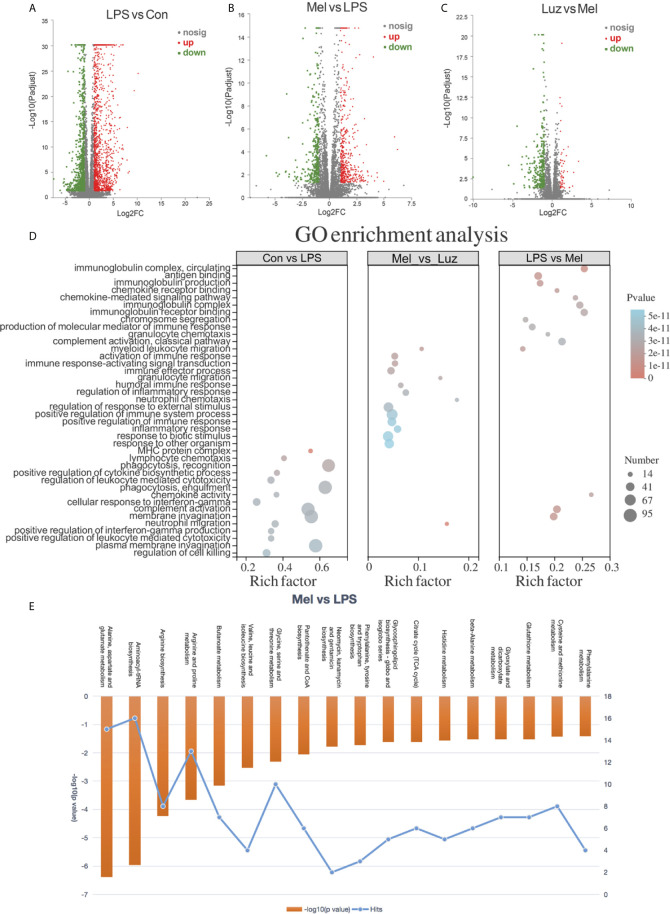
Figure 6.
Transcriptional profiles among the Con, LPS, Mel, and Luz groups. Volcano plots show the differentially expressed genes among the LPS vs Con (A), Mel vs LPS (B), and Luz vs Mel (C) three comparisons. The x-coordinate represents the log2FC and the y-coordinate represents -log10 (p value). Red points indicate significantly upregulated genes, blue points indicate significantly downregulated genes, and gray points indicate non-significantly different genes. (D) Functional GO enrichment analysis of differentially expressed genes among LPS vs Con, Mel vs LPS, and Luz vs Mel. (E) Histogram of significantly enriched metabolic pathways by MetaboAnalyst between Mel vs LPS (p value <0.05). The left ordinate represents −log10 (p value) and the right ordinate represents the number of genes in the metabolic pathway, and the upper abscissa represents the enhanced metabolic pathways. N = 6–8 in each group.

