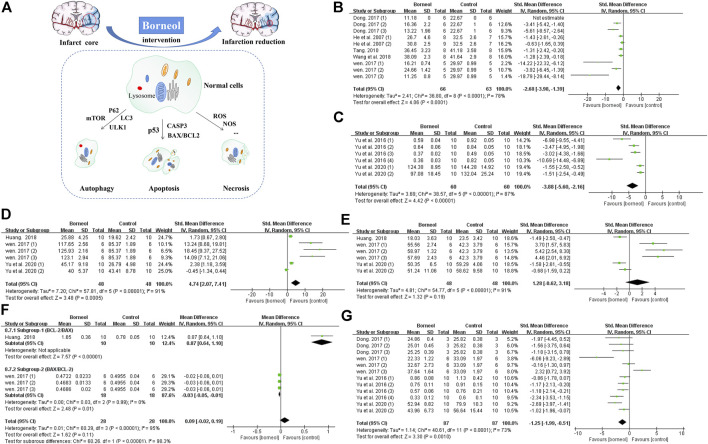
FIGURE 9.
(A) Borneol reduces the size of cerebral infarction by improving various forms of cell death. (B) The forest plots: the borneol group vs. the control group on cerebral infarction rate. Five studies with ten comparisons to evaluate cerebral infarction size by TTC staining, showing a significant difference but with high heterogeneity (nT/nC = 66/63, SMD −2.68, 95% CI: −3.98 to −1.39, p < 0.0001, heterogeneity χ 2 = 36.80, df = 8, I 2 = 78%). (C) The forest plots: the borneol group vs. the control group on expression of p53. Meta-analysis of two studies showed that animals in the borneol group had significant lower p53 levels than the control group with high heterogeneity (nT/nC = 60/60, SMD −3.88, 95% CI: −5.60 to −2.16, p < 0.00001, heterogeneity χ 2 = 38.57, df = 5, I 2 = 87%). (D) The forest plots: the borneol group vs. the control group on expression of BCL2. Three studies showed that animals in the borneol group had statistically significant higher BCL2 levels than the control group with high heterogeneity (nT/nC = 48/48, SMD 4.74, 95% CI: 2.07 to 7.41, p = 0.0005, heterogeneity χ 2 = 57.81, df = 5, I 2 = 91%). (E) The forest plots: the borneol group vs. the control group on expression of BAX. Three studies based on the measurement of BAX expression showed no significant difference between the borneol group and the control group with high heterogeneity (nT/nC = 48/48, SMD 1.28, 95% CI: −0.62 to 3.18, p = 0.19, heterogeneity χ 2 = 54.77, df = 5, I 2 = 91%). (F) The forest plots: the borneol group vs. the control group on ratio between BCL2 and BAX. Subgroup 1 (nT/nC = 10/10, MD 0.87, 95% CI: 0.64–1.10) and subgroup 2 (nT/nC = 18/18, MD −0.03, 95% CI: −0.05 to −0.01, p = 0.01, heterogeneity χ 2 = 0.03, df = 2, I 2 = 0%) are BCL2/BAX and BAX/BCL2, respectively. Both subgroups suggest that borneol can improve the ratio between BAX and BCL2. (G) The forest plots: the borneol group vs. the control group on expression of Caspase-3. Expression of Caspase-3 was reported in four studies with 12 comparisons. Meta-analysis showed a significant difference in down-regulating the expression levels of CASP3 but with substantial heterogeneity (nT/nC = 87/87, SMD −1.25, 95% CI: −1.99 to −0.51, heterogeneity χ 2 = 40.61, df = 11, I 2 = 73%). The above indicators with high heterogeneity have not found their respective resources.

