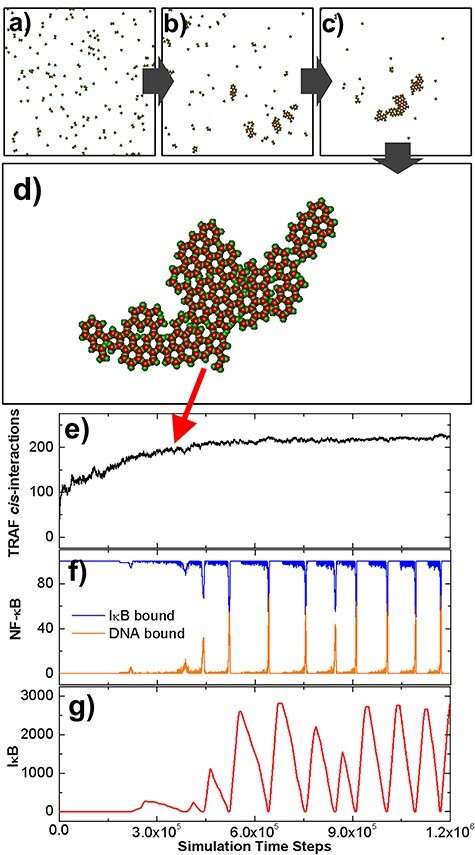
Figure 2 .

The initial configuration of the diffusion–reaction simulation is shown in (a). Some representative snapshots along the simulation trajectory were selected in (b) and (c). The configuration that the system reached equilibrium is further shown in (d). In (e), we plotted the number of cis-interactions between TRAF trimers observed in the system along with the simulation time steps. The kinetic profiles of molecular components in the downstream signaling network were further plotted as functions of simulation time steps. These profiles are the numbers of NF-κB molecules, which bind to IκB and DNA, as shown by the blue and orange curves in (f), and the total number of free IκB in the system, as shown by the red curve in (g).
