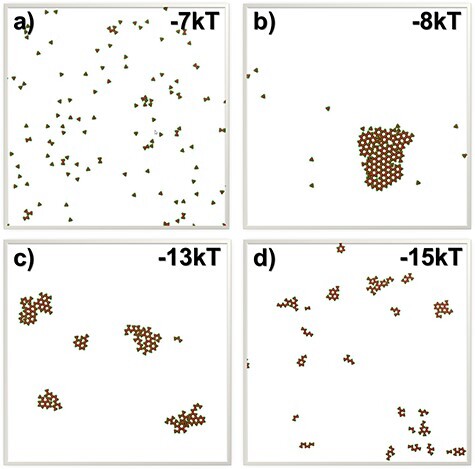
Figure 5 .

To illustrate the relation between the spatial properties of TRAF clusters and the strength of their cis-interactions, the final configurations from the systems in which binding affinities equal −7 and −8 kT are plotted in (a) and (b). These two plots show that the clustering can generate very different spatial pattern with only a slight change in the binding affinity. On the other hand, the final configurations from the systems in which binding affinities equal −13 and −15 kT are plotted in (c) and (d), respectively. These two plots suggest that systems with stronger binding affinity contain more clusters with smaller sizes.
