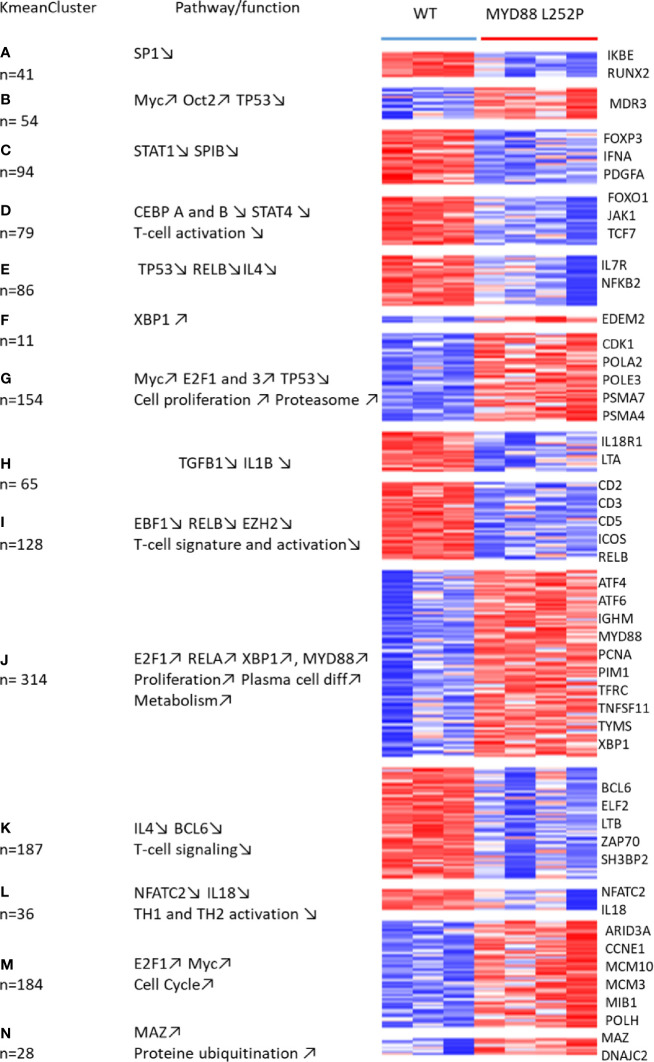
Figure 9.
Whole transcriptome analysis of Cd19Cre and Myd88L252P mice: total mRNA was extracted from whole spleen tissues. Gene expression profiles were obtained using the MoGene-2_1-st-v1 Affymetrix chip. mRNA transcripts (3236) were selected to be differentially expressed using the Limma R package. Expressed genes that were too heterogeneous were eliminated, resulting in a final selection of 1515 genes. These genes were segregated into 40 Kmean clusters. The closest Kmean clusters were merged 2 by 2 according to their proximity by principal component analysis of the mean vectors. This was repeated until maximization of the absolute value of Chi2 (29). This resulted in 14 aggregated clusters. Functional annotation of the aggregated Kmean clusters was performed using the Ingenuity Pathway Analysis (IPA) Software. Annotated heatmap of the 1515 genes are segregated into the 14 aggregated clusters. Left: the aggregated Kmean clusters with the corresponding number of genes; middle: main pathways and or function identified with the IPA software; right: some relevant genes.

