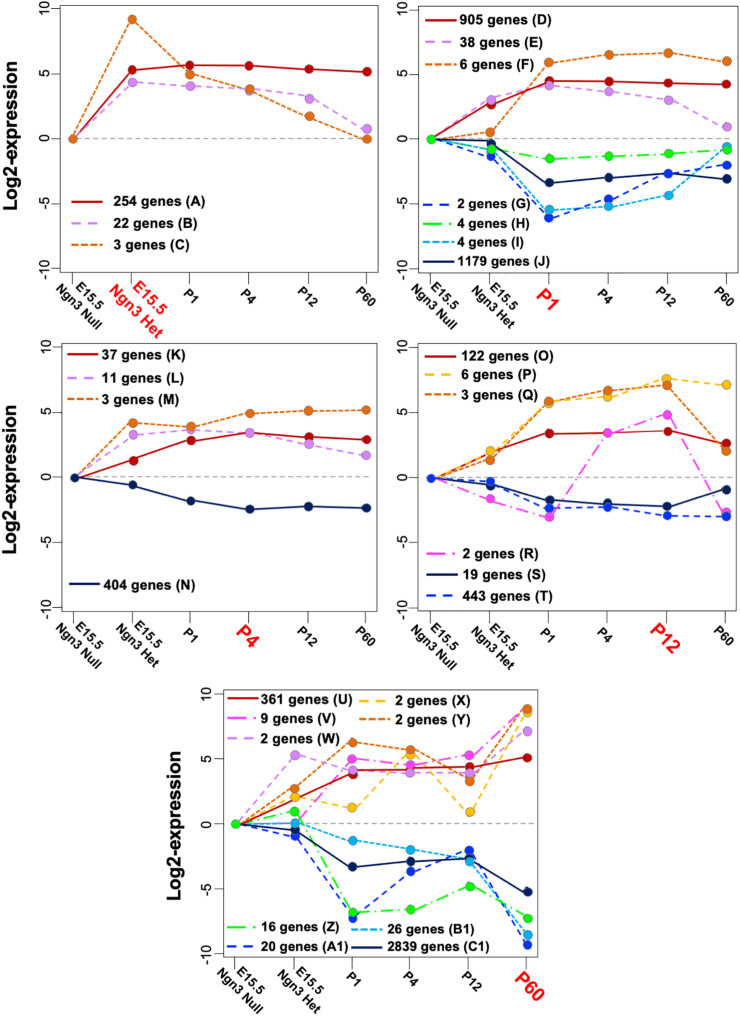
FIGURE 3.
Mature patterns (MPs) identified in maturing β cells. Positive and negative MPs classified according to their time break (highlighted in red) and the dynamic expression across all stages. Note that the line y = 0 represents the basal gene expression at E15.5 in Ngn3eGFP/eGFP cells that do not express endocrine specific genes. The capital letters are referred to in the MP description in Supplementary Table 1 and in the main text.

