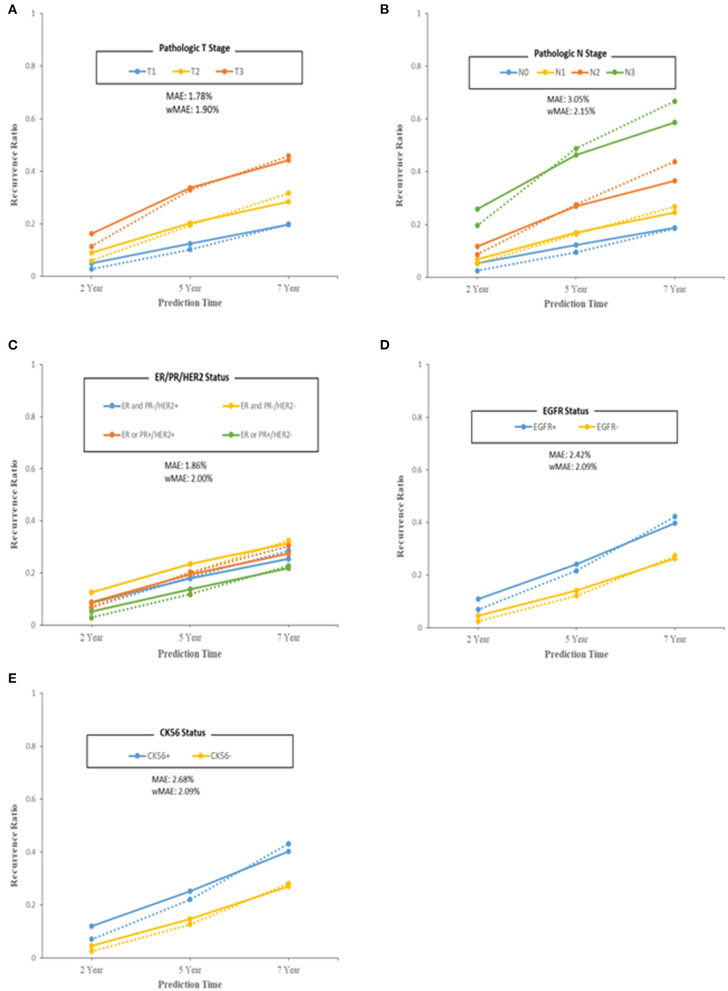
Figure 4.
Performance of the final model in terms of model error (predicted–observed) over each of the 2/5/7 years. Patients were grouped by breast cancer features. (A) Pathologic T stage. (B) Pathologic N stage. (C) ER/PR/HER2 status. (D) EGFR status. (E) CK56 status. For model specificity and accuracy, Median Absolute Error (MAE) and weighted Mean Absolute Error (wMAE) were calculated at each group or bin. Solid lines indicate observed recurrence proportion, and dashed lines indicate predicted recurrence proportion.

