
Fig. 4.
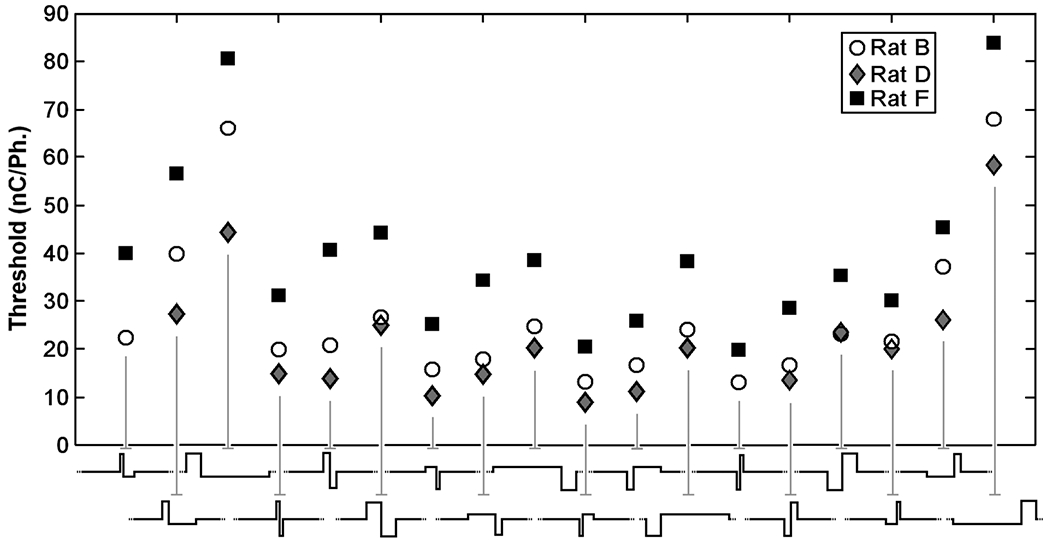
Interaction plot showing mean threshold levels for rats B, D, F for the waveforms in the factorial experiment. Waveforms are grouped by lead phase direction and PAF in ascending order of phase duration. There was no statistical evidence of rat waveform interaction when analyzed under the block-treatment interaction model using rats as the blocking factor (p = 0.52).