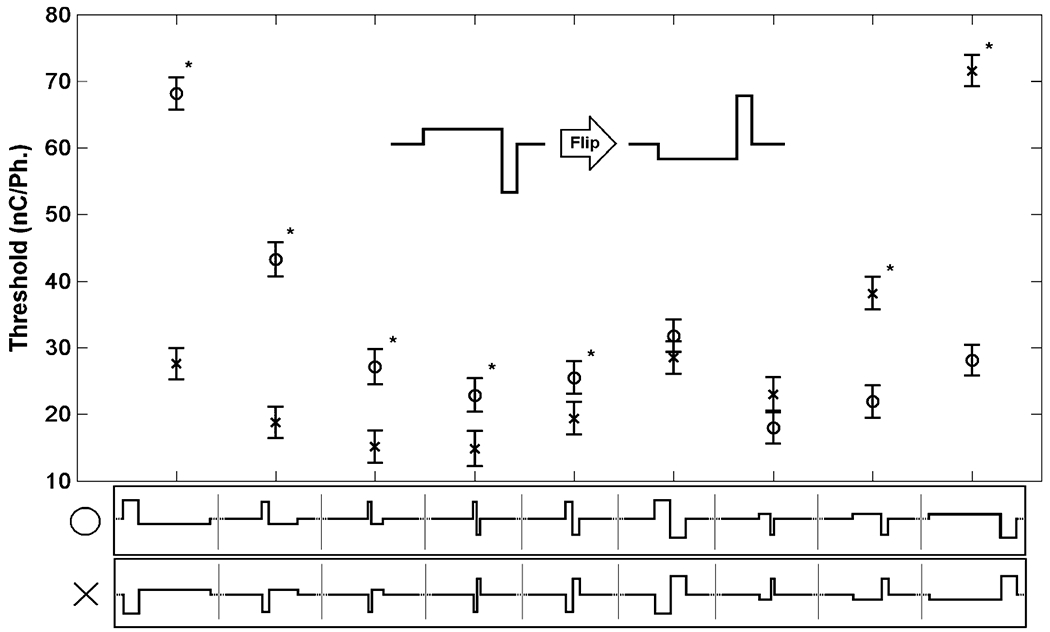
Fig. 5.

“Flip” comparison of the Factorial experiment. Comparisons were made between waveforms of equal phase duration and PAF but opposite lead phase direction in order to determine the effect of stimulus direction on mean threshold level. Waveforms with an anodal leading phase are represented by “o” while waveforms leading with a cathode phase are represented by “x”. Tukey’s test for multiple comparisons was used (α = 0.05, “*” indicates waveforms that resulted in significantly different behavioral thresholds). Error bars show the 95% confidence interval of the least squares estimate of the mean.
