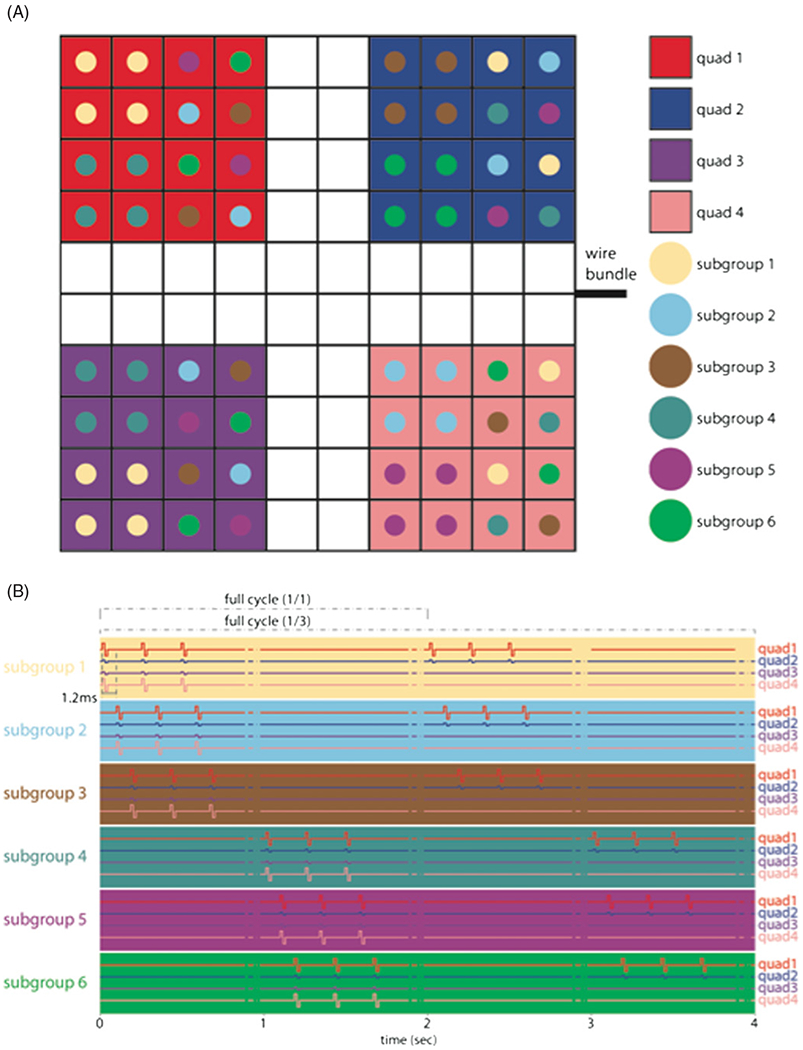
Figure 2.

(A) Electrode arrangement in each array. Each quad of electrodes was subjected to a different regime of stimulation (see table 1 for summary). White squares denote control electrodes. (B) Arrays were divided into subgroups designed to control the amount of charge that was simultaneously delivered to the animal. Within a given quadrant, all subgroups were stimulated with the same stimulation parameters.
