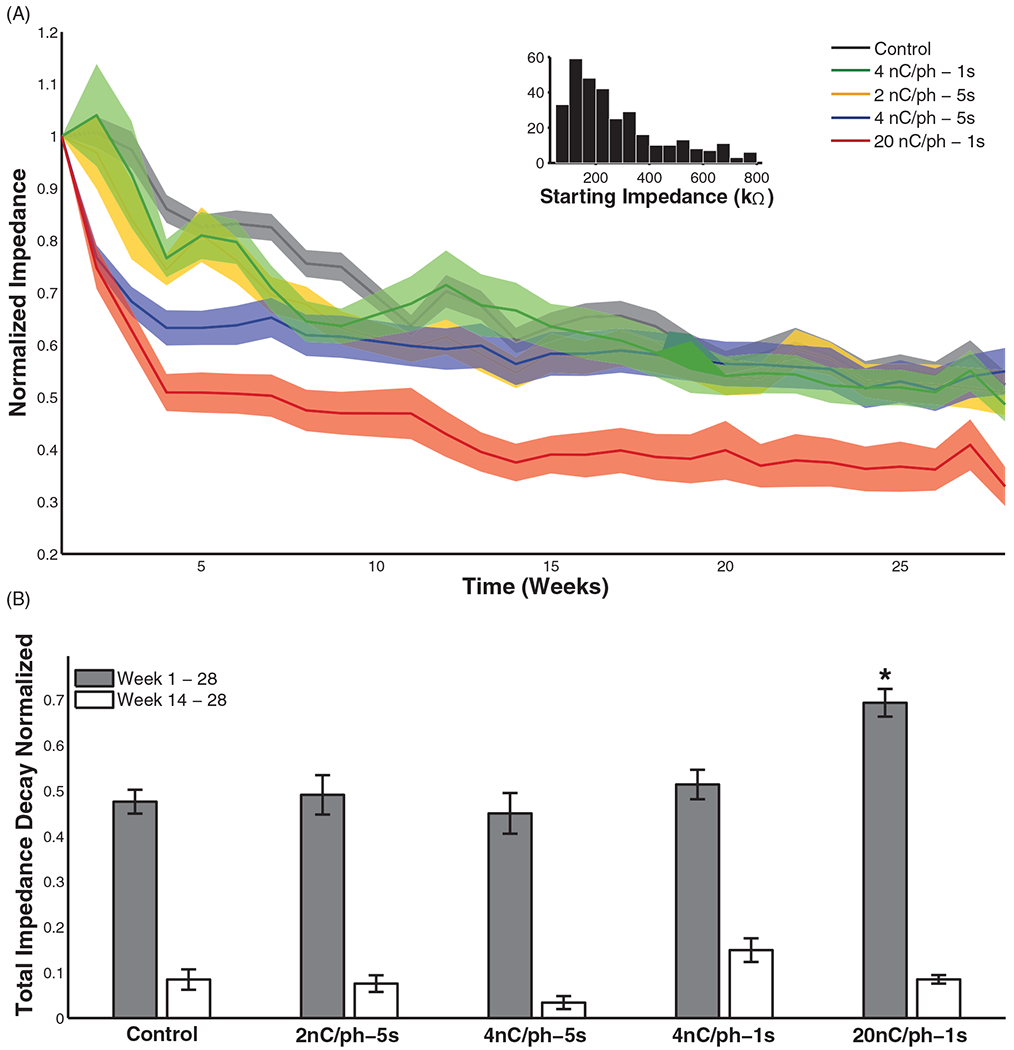
Figure 3.

(A) Pre-stim impedance decay over time comparing the effect of stimulation at 2, 4, and 20 nC/phase ICMS as well as 1 and 5 s interval durations, with the 1:1 duty cycle. Values were normalized to the pre-stim impedance on week 1. Shaded region indicates standard error of the mean, reflecting the variability across electrodes subjected to each regime of stimulation at each point in time. (B) Total pre-stim impedance decay from week 1–28 and week 14–28. The only condition that differed significantly from the controls was the 20 nC/phase for week 1–28 (Tukey’s HSD, p < 0.01).
