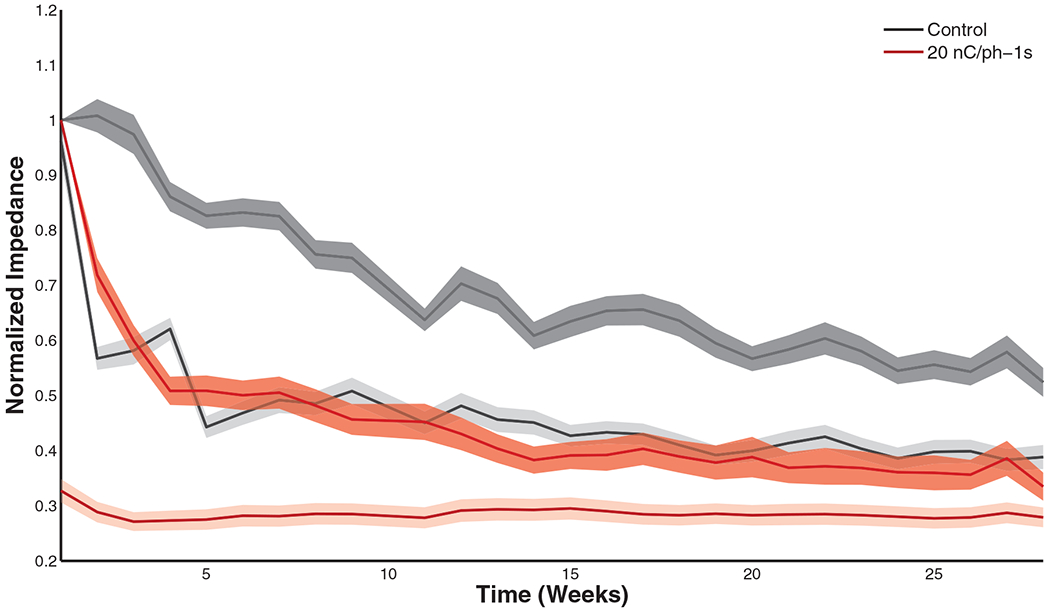
Figure 4.

Pre-stim (dark band) and post-stim (light band) impedance decay over time for the control and 20 nC/phase conditions. Shaded region denotes the standard error of the mean. Overall differences between pre- and post-stim were significant (table 3(c)).
