
Figure 5.
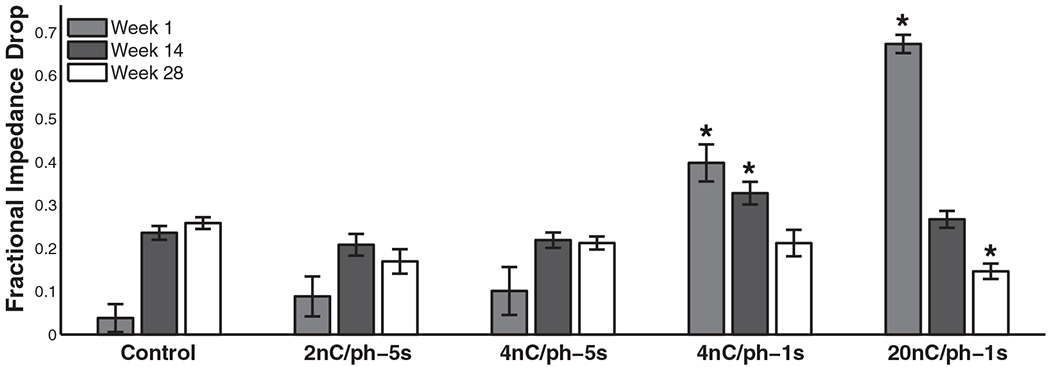
Comparison of the impedance drop as a fraction of pre-stim values after stimulation blocks in the first week (1), midpoint (14), and last week (28) of the study. Post-hoc tests revealed that the 4 nC/phase–1 s and 20 nC/phase condition differed significantly from the controls in the first week; only the 4 nC/phase–1 s condition differed significantly from controls in week 14; and only the 20 nC/phase condition differed significantly from the controls in the last week (Tukey’s HSD, p < 0.01).