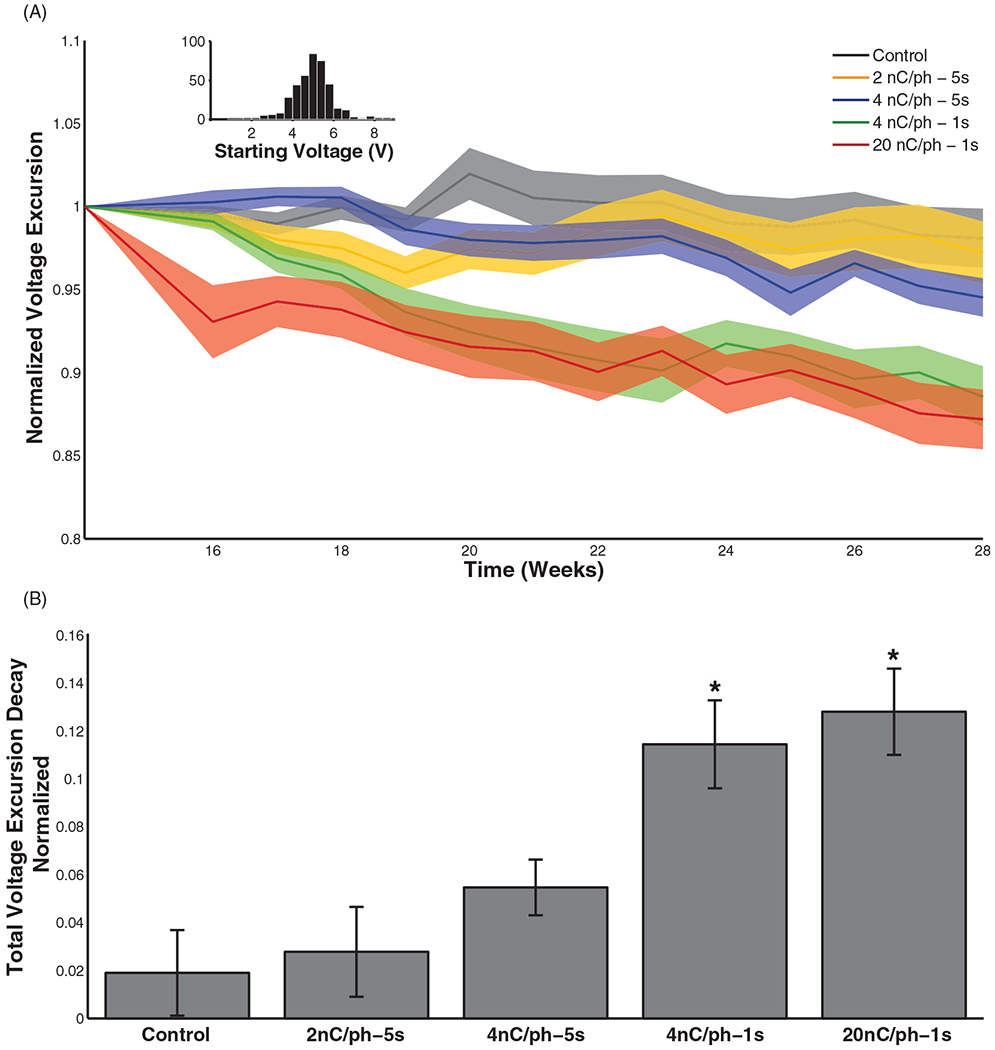
Figure 6.

(A) Pre-stim voltage excursion amplitudes (difference between anodic and cathodic voltage peaks) over time (for the last 14 weeks of the study) comparing the effect of stimulation at 2, 4, and 20 nC/phase ICMS as well as 1 and 5 s interval durations. Values were normalized to the pre-stim voltage excursion at week 14. Shaded region indicates standard error of the mean, reflecting the variability across electrodes subjected to each regime of stimulation at each point in time. Inset: histogram of absolute starting voltage excursion amplitudes for all electrodes. (B) Total voltage excursion decay from week 14–28. The 4 nC/phase–1 s and 20 nC/phase stimulation conditions differed significantly from the controls (Tukey’s HSD, p < 0.01). In all stimulation conditions, a 20 nC/phase pulse was used to measure voltage excursions.
