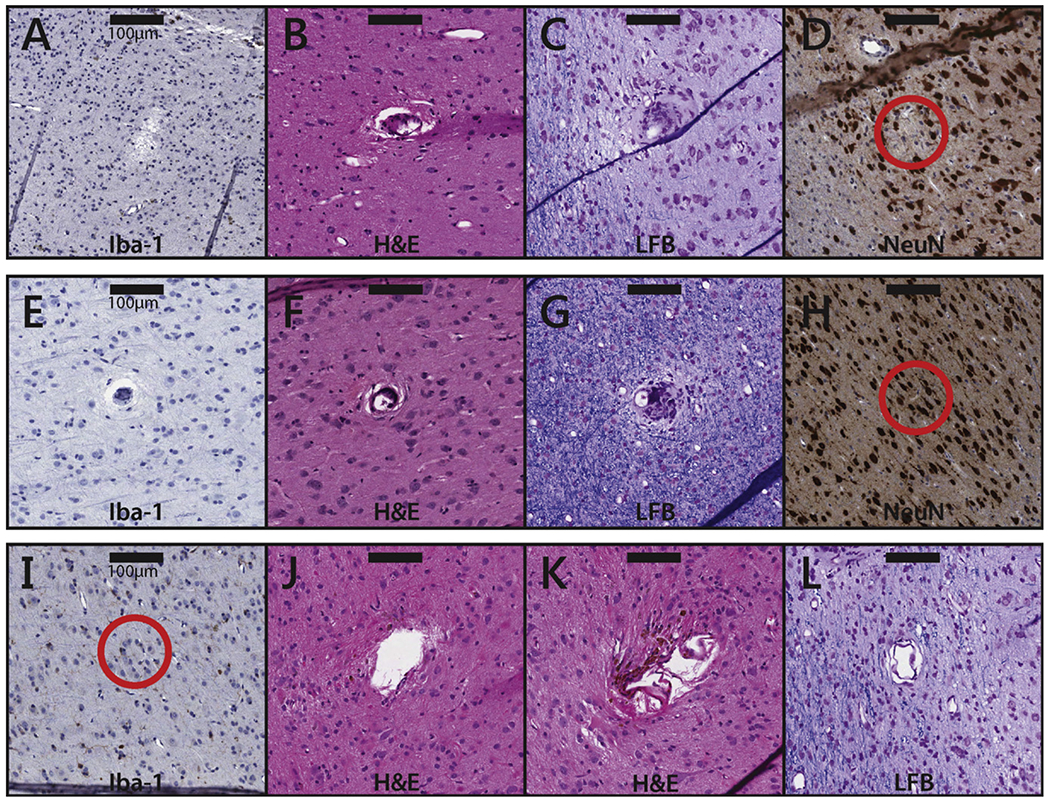
Figure 5.

Tissue samples near electrode tips subjected to different conditions. (A)–(D) Samples near electrode tips in unstimulated (control) tissue. The samples are taken from slices that were stained with Iba1 (A), H&E (B), LFB (C), and NeuN (D), respectively. The scale bars represent 100 μm. Note that, in these samples, the observed damage can only be attributed to the implantation, residence, or explantation of the array. (E)–(H) Samples near electrode tips that were subjected to 20 μA stimulation. Duty cycles were all 1/3; stimulation durations were 1 s (E), 1 s (F), 5 s (G), and 1 s (H). The tissue samples are taken from slices that were stained with Iba1 (E), H&E (F), LFB (G), and NeuN (H). (I)–(L) Samples near electrode tips that were subjected to 100 μA stimulation. Duty cycles were 1/1 (I) and 1/3 ((J)–(L)). All stimulation durations were 1 s. The tissue samples are taken from slices that were stained with Iba1 (I), H&E (J&K), and LFB (L). The scale bar represents 100 μm.
