Figure 6.

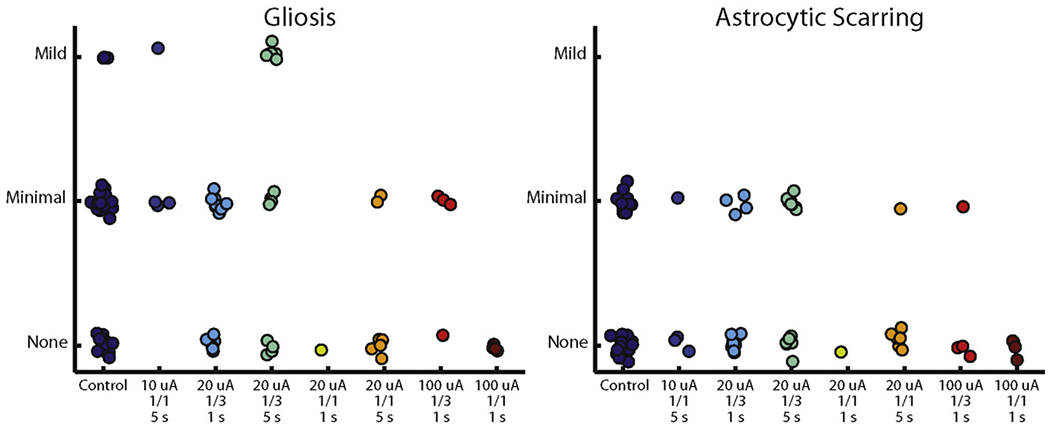
Distribution of scores for each sample. The only group whose score distribution was significantly different from the control condition was the 20 μA, 1/3 duty cycle, 5 s condition (p = 0.03, Fisher–Freeman–Halton exact test).

Distribution of scores for each sample. The only group whose score distribution was significantly different from the control condition was the 20 μA, 1/3 duty cycle, 5 s condition (p = 0.03, Fisher–Freeman–Halton exact test).