
FIGURE 4.
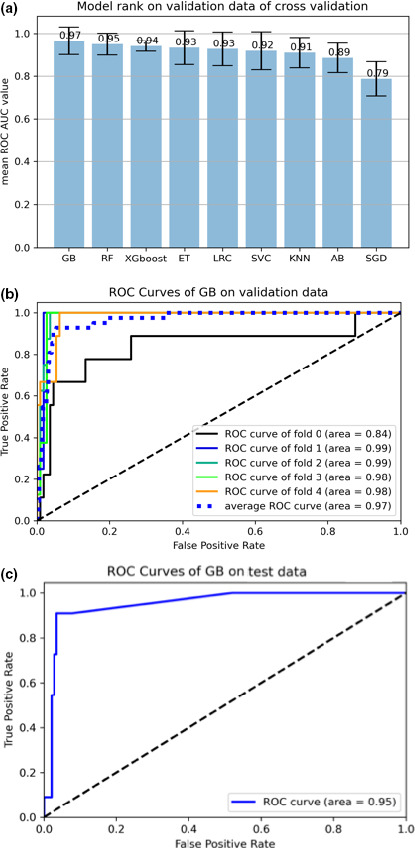
Models and ROC curves. (a) All available ML models ranked by average validation performance for predicting the biopsy examination outcome by risk factor features from a cervical cancer dataset. The error bars indicate the standard error of the ROC values over the fivefolds. (b) ROC curves of gradient boosting classifier on validation, and (c) test data for the cervical cancer dataset. AUC, area under the curve; GB, gradient boosting; ML, machine learning; ROC, receiver operating characteristic