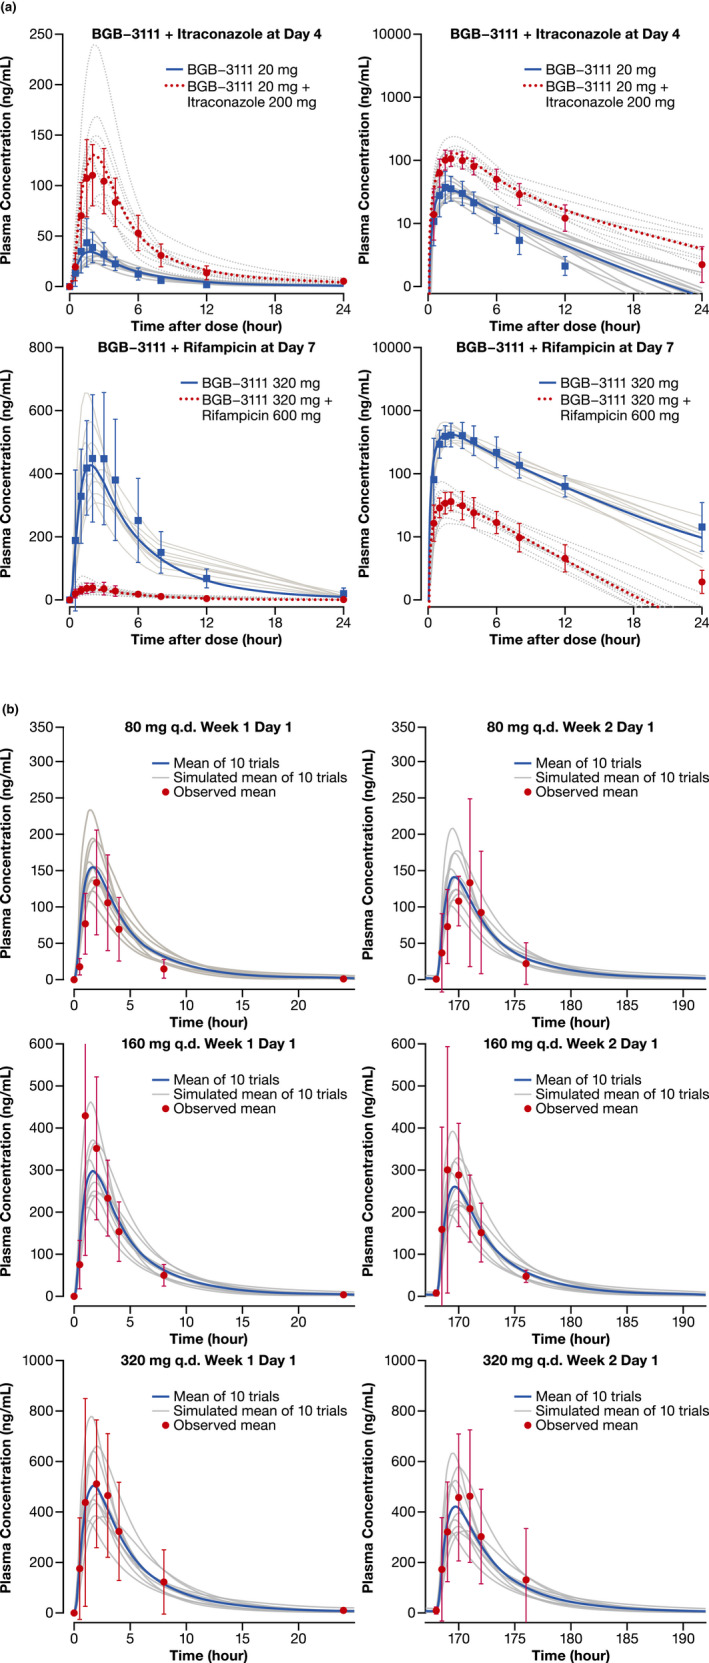
Figure 2.

Simulated and observed plasma concentration‐time profiles of zanubrutinib in healthy subjects and in patients with B‐cell malignancies. (a) Healthy subjects with or without co‐administration of itraconazole or rifampicin (Left = Linear Scale; Right = Semi‐Log Scale) (b) Patients with B‐cell malignancies following single and repeated dose of zanubrutinib 80 mg, 160 mg, and 320 mg. The grey lines represent individual trials (n = 10×10) and the solid blue lines or red dashed lines are the mean of the simulated population (n = 100). Observed data shown are mean (the dotted points) and standard deviation. Age range is 20–50 years old and ratio of females is 0.16 (healthy subjects). Age range is 20–90 years old and ratio of females is 0.3 (patients). Abbreviations: b.i.d., twice daily; q.d., once daily.
