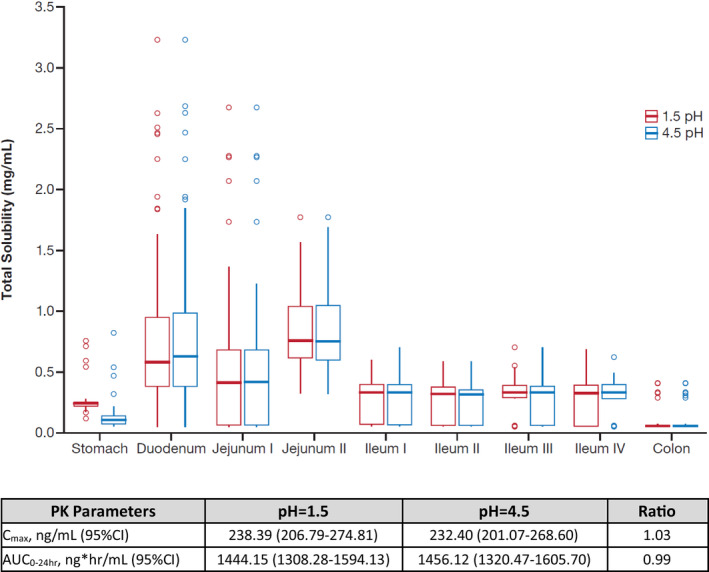
Figure 3.

Predicted effect of gastric pH values (pH=1.5 and 4.5) on solubility and PK parameters of zanubrutinib. Abbreviations: AUC0‐24 hr, area under the plasma concentration–time curve from time 0 to 24 hours; CI, 95% confidence interval; Cmax, maximum plasma concentration; PK, pharmacokinetic; ratio, calculated by the ratio of pH=1.5 and pH=4.5.
