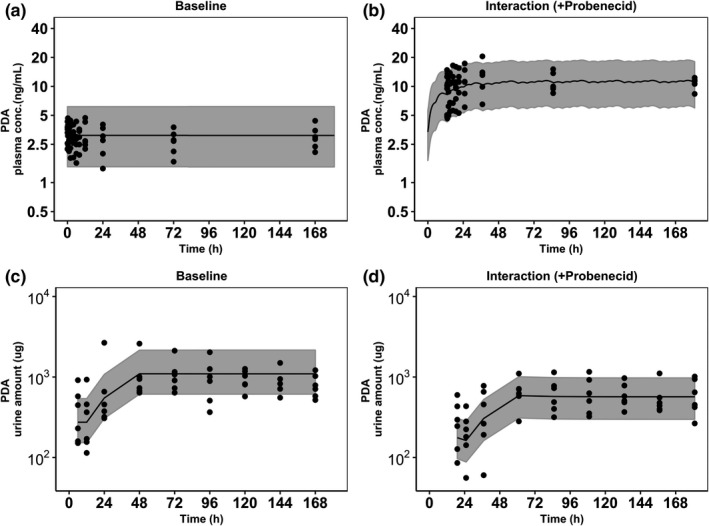
FIGURE 2.

Visual predictive checks of the developed population pharmacokinetic pyridoxic acid (PDA) model superimposed with the observed data. Panels represent PDA plasma baseline (a), plasma data in the presence of probenecid (b), urine PDA baseline (c), and urine PDA data in the presence of probenecid (d). Shaded areas represent 90% prediction interval, black dots (●) represent observed data, and black lines (–) are the median lines
