
FIGURE 5.
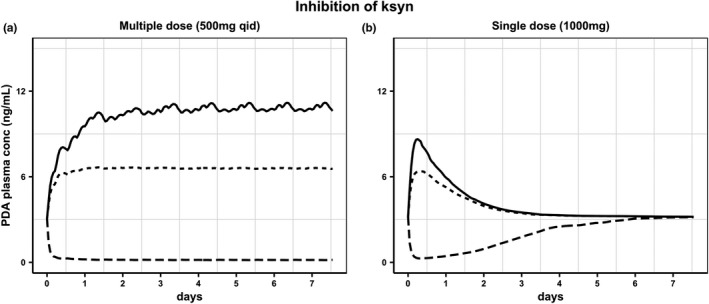
Simulated pyridoxic acid (PDA) plasma concentrations assuming the effect of OAT1/3 inhibitor also on biomarker synthesis (ksyn). Hypothetical ratio of 0 (continuous line) corresponds to no effect on PDAk syn. The values of 0.1 (dotted line), and 10 (dashed line) represent 10‐fold lower and higher, respectively, inhibitory effect on PDAk syn than the effect on OAT1/3‐mediated CLr of the biomarker. Scenarios simulated following (a) multiple doses of probenecid (500 mg every 6 h) or (b) single dose of probenecid (1000 mg)