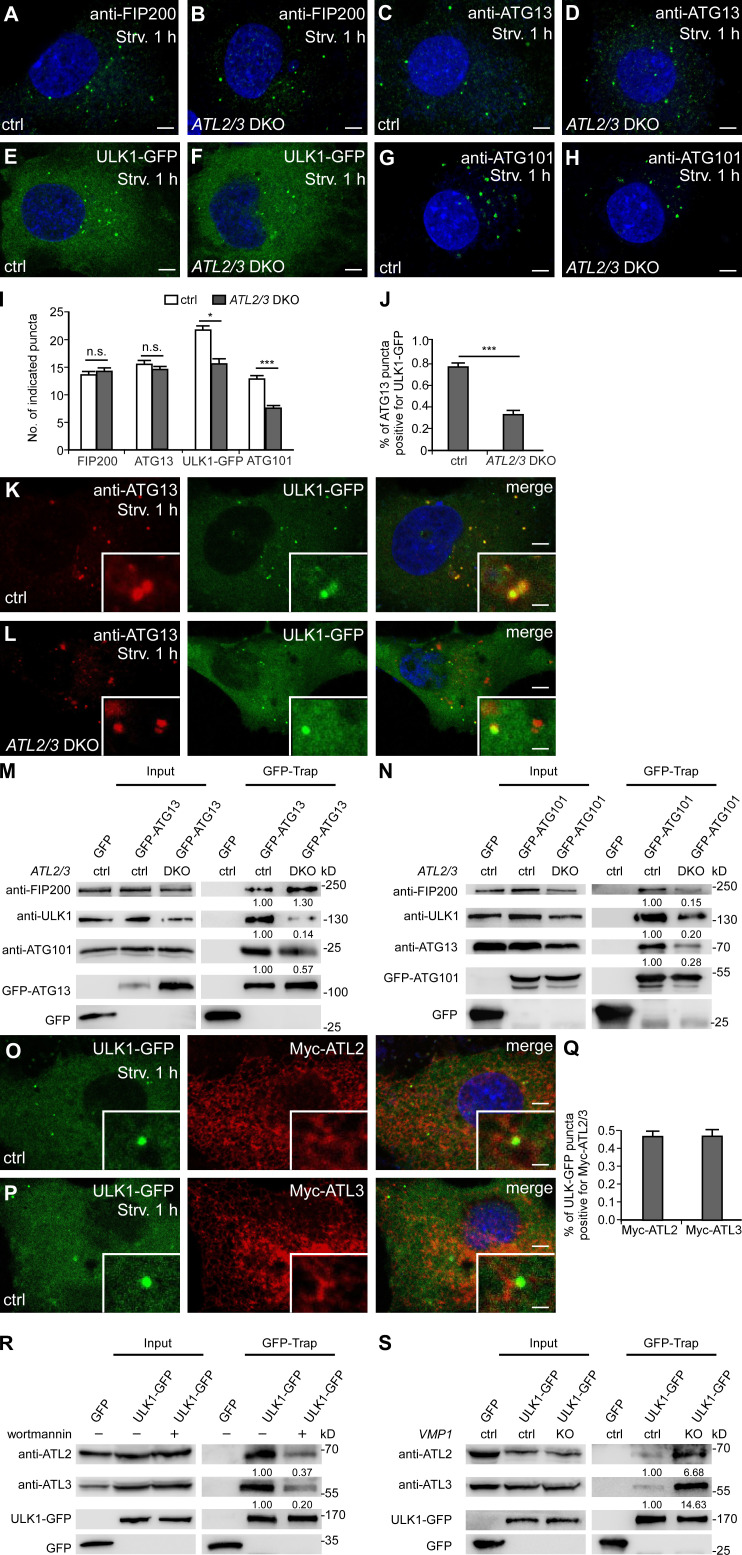
Figure 4.
ATL2/3 contribute to the recruitment of ULK1 to the autophagosome formation sites specified by FIP200/ATG13. (A and B) Compared with control cells (A), puncta formed by endogenous FIP200 (detected by anti-FIP200) show no evident change in ATL2/3 DKO COS-7 cells (B) after 1 h of starvation. Scale bars, 5 µm. (C and D) Compared with control cells (C), puncta labeled by anti-ATG13 antibody are not changed in ATL2/3 DKO COS-7 cells (D) after 1 h of starvation. Scale bars, 5 µm. (E and F) ULK1-GFP forms fewer puncta in ATL2/3 DKO COS-7 cells (F) compared with control cells (E) after 1 h of starvation. Scale bars, 5 µm. (G and H) Compared with control cells (G), fewer puncta are labeled by anti-ATG101 antibody in ATL2/3 DKO COS-7 cells (H) after 1 h of starvation. Scale bars, 5 µm. (I) Quantitative data for A–H are shown as mean ± SEM (n = 30 cells in each group). *, P < 0.05; ***, P < 0.001. (J–L) The relationship between ATG13 puncta and ULK1-GFP puncta in control (K) and ATL2/3 DKO COS-7 cells (L) after 1 h of starvation. The percentage of ATG13 puncta positive for ULK1-GFP is decreased in ATL2/3 DKO cells (L) compared with control cells (K) after 1 h of starvation. Quantitative data are shown in J as mean ± SEM (n = 20 cells in each group). ***, P < 0.001. Scale bars, 5 µm; inset scale bars, 0.5 µm. (M) Levels of endogenous ULK1 and ATG101 coprecipitated by GFP-ATG13 are decreased in ATL2/3 DKO COS-7 cells compared with control cells in GFP-Trap assays, while levels of endogenous FIP200 precipitated by GFP-ATG13 are not reduced. Quantifications of ULK1, ATG101, and FIP200 levels (normalized by GFP-ATG13 levels) are also shown. (N) Levels of endogenous FIP200, ULK1, and ATG13 coprecipitated by GFP-ATG101 are dramatically decreased in ATL2/3 DKO COS-7 cells compared with control cells in GFP-Trap assays. Quantifications of FIP200, ULK1, and ATG13 levels (normalized by GFP-ATG101 levels) are also shown. (O–Q) A subset of ULK1-GFP punctate structures accumulate at distinct Myc-ATL2 (O) and Myc-ATL3 (P) puncta in control cells after 1 h of starvation. Myc-ATL2 and Myc-ATL3 puncta are defined as having a fluorescence intensity that is clearly stronger than the surrounding area. Quantitative data are shown in Q as mean ± SEM (n = 15 cells in each group). Scale bars, 5 µm; inset scale bars, 0.5 µm. (R) In cells treated with wortmannin, levels of endogenous ATL2 and ATL3 precipitated by ULK1-GFP are dramatically decreased compared with untreated cells. Quantification of ATL2 and ATL3 levels (normalized by ULK1-GFP levels) are also shown. (S) Levels of endogenous ATL2 and ATL3 precipitated by ULK1-GFP are increased in VMP1 KO COS-7 cells compared with control cells in GFP-Trap assays. Quantifications of ATL2 and ATL3 levels (normalized by ULK1-GFP levels) are also shown. ctrl, control; Strv, starved.

