Figure S2.
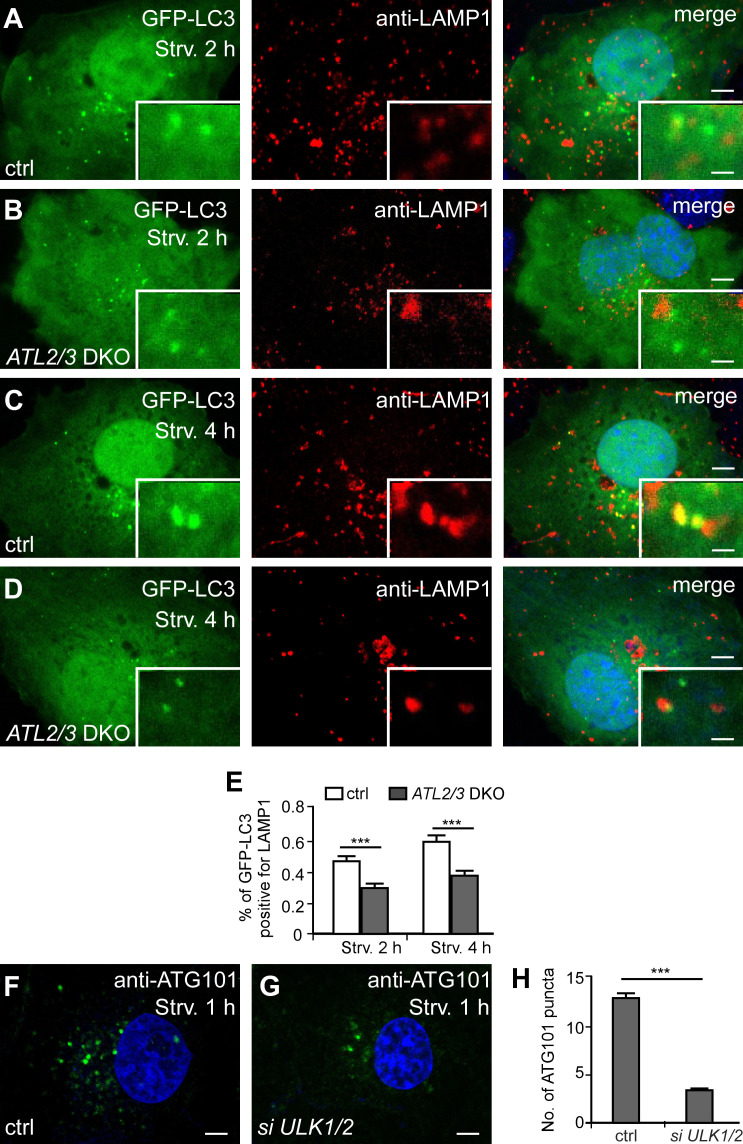
The autophagic flux is delayed in ATL2/3 DKO cells. (A–E) Compared with control cells (A and C), the percentage of GFP-LC3 puncta that closely associate or colocalize with LAMP1 puncta is less in ATL2/3 DKO (B and D) after 2-h starvation (A and B) or after 4-h starvation (C and D). Quantitative data are shown in E as mean ± SEM (n = 20 cells in each group). Scale bars, 5 µm; inset scale bars, 0.5 µm. (F and G) Compared with control cells (F), the number of ATG101 puncta is dramatically decreased in ULK1/2 KD cells (G). Scale bars, 5 µm. (H) Quantitative data for F and G are shown in H as mean ± SEM (n = 30 cells in each group). ***, P < 0.001. ctrl, control; Strv, starved.

