Figure 1.
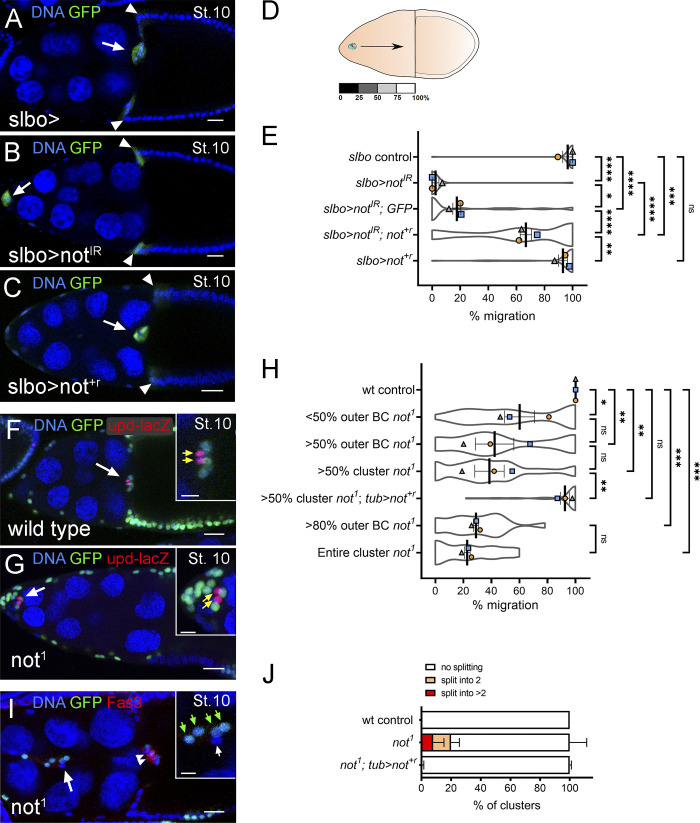
not is required in outer BCs for migration and cluster integrity. (A–D) Confocal micrographs of stage 10 egg chambers: outer BCs (arrows) and some centripetal follicle cells (arrowhead) marked with GFP (green) under the control of slbo-GAL4. (A) slbo-GAL4 control (slbo>) showing complete migration of the BC cluster. (B and C) RNAi knockdown of not (slbo>notIR) abrogated BC migration, whereas overexpression of not+r (C; slbo>not+r) did not. (D) Depiction of egg chamber showing distance measured for quantification of migration. (E) Plots showing mean migration ± SEM derived from means of each replicate superimposed on violin plots of migration measurements for each indicated genotype. The effect of notIR can be partially rescued by overexpression of RNAi-resistant not (slbo>not+r notIR) but not overexpression of UAS-GFP (slbo>notIR, GFP). *, P < 0.05; **, P < 0.01; ***, P < 0.001; ****, P < 0.0001 by one-way ANOVA. (F and G) Confocal micrographs of egg chambers with GFP-labeled clones (green); polar cells are marked with upd-lacZ (red; indicated with yellow arrows in inset). Compared with control BC clusters, which routinely complete migration at stage 10 (F), not1 clusters display defective migration (G). (H) Quantitation of migration defects at stage 10 reveals that clusters with >50% mutant outer BCs are more severely affected than those with <50% mutant outer BCs; migration is largely restored by not+r overexpression (tub>not+r; not1). Migration defect in clusters with >80% mutant outer BCs was not significantly different from those in which the entire cluster was mutant. (I) Stage 10 egg chamber with polar cells (arrowheads) labeled with Fas3 (in red) showing splitting of not1 BCs. The inset shows a magnified image of GFP+ BCs (green arrows, GFP–; white arrows, BCs). (J) 18% of clusters displayed splitting into two groups of cells, 10% of clusters split into more than two groups of cells. Nuclei are labeled with TO-PRO-3 (blue) in all images. Replicate trials consisted of ≥20 egg chambers per genotype. Scale bars in confocal images are 25 µm (insets, 10 µm). St., stage.

