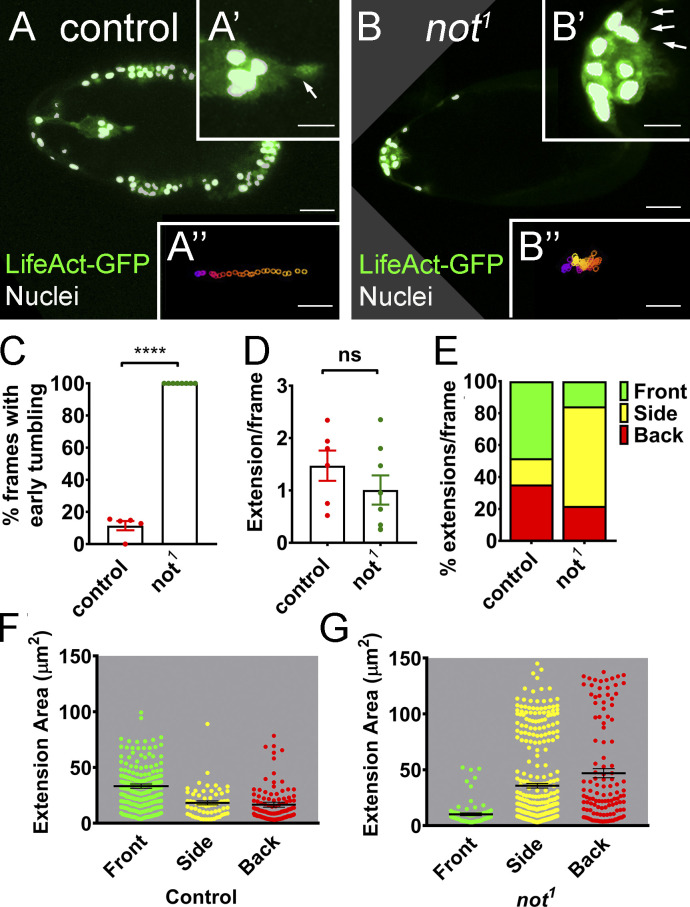
Figure 4.
Loss of not results in loss of polarized protrusions, retarded migration, and early tumbling. (A and B) Still images from time-lapse imaging of LifeAct-GFP–labeled BCs near the start of BC migration with nuclear GFP-labeled MARCM clones labeled in white and LifeAct-GFP in green. (A) Control egg chamber with clearly visible polarized F-actin protrusion at the leading edge of the cluster (arrow in magnified image A’), leading to progressive migration from anterior to posterior (track A’’, generated using a custom macro; Poukkula et al., 2011). (B) In contrast, not1 clusters display multiple shorter protrusions at different positions around the cluster (arrows in B’), leading to poorly directed movement of the cluster toward the posterior pole (track B’’). Scale bars in confocal images are 25 µm (10 µm for A’/B’ insets and 25 µm for A’’/B’’ insets). (C–G) Quantitation of time-lapse images from WT control (n = 5) and not1 (n = 7 clusters that failed to readily delaminate) LifeAct-GFP–labeled BC clusters, showing effects on tumbling and actin-based cellular protrusions. (C) Graph showing percentage of frames from the first half of migration with tumbling BCs. Individual data points together with mean ± SEM not1 show significant increases in early tumbling. ****, P < 0.0001 by Student’s t test. (D) Graph of total cellular extensions/frame after segmentation. There is no significant difference (by Student’s t test) between WT control and not1. (E) Graph of percentage of extensions/frame at front, back, and sides of the cluster, showing a higher proportion of extensions at the side of not1 clusters compared with controls. (F and G) Measurements of the area of extensions detected at front, back, and sides of WT and not1 clusters together with mean area ± SEM show that the size of protrusions at the front is reduced in not1 clusters concomitantly with an increase in the size of extensions at the side and back.

