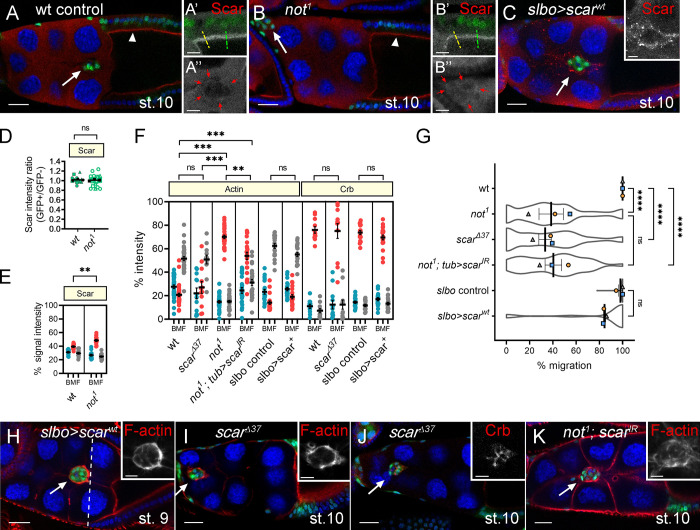
Figure 5.
Not does not act by stabilizing Scar during BC migration. (A and B) Scar levels are not reduced in not1 follicle or BCs. Confocal micrographs show Scar staining (red) in WT (A) and not1 (B) GFP-labeled MARCM clones (green) at stage 10 of egg chamber development. Arrowhead, follicular epithelium; arrow, BC. Magnified image of Scar, shown in grayscale in A’, predominantly localizes to apical junctions of columnar follicle cells. Magnified image in A’ shows Scar staining is cytoplasmic in nurse cells but in BCs, can be detected at outer junctions of the cluster (red arrows). (B) Scar is similarly localized in not1 clones, with no reduction in level at the apical side of follicle cells (B’) but can be observed at BC–BC junctions (B’’). (C) Overexpression of WT Scar (Scarwt) using slbo-GAL4 results in a robust signal, confirming Scar staining at the outer junctions of BCs. (D) Quantification of Scar levels (as in A’ and B’; n ≥ 5 egg chambers/replicate). (E) Quantification of Scar signal intensity at back, middle, and front (BMF) of the cluster (n ≥ 5 egg chambers/replicate). (F) Dot plots showing quantification of F-actin and Crb signal intensities across the cluster in indicated genotypes (n ≥ 3 cluster/replicate). (G) Graphs showing mean migration ± SEM derived from means of n > 15 egg chambers/replicate of the indicated genotypes superimposed on violin plots. (H and I) GFP-labeled BC clusters (in green) with overexpressed Scarwt or scar loss of function (scarΔ37), respectively, show normal F-actin polarity. (J) GFP-labeled scarΔ37 clusters (in green) show normal Crb polarity. (K) Accumulation of F-actin into the junction in not1 clones is partially rescued by knockdown of scar (not1 scarIR). TO-PRO-3 (blue) stains all nuclei in all images. Scale bars are 25 µm (inset, 10 µm). **, P < 0.01; ***, P < 0.001; ****, P < 0.0001. st., stage.

