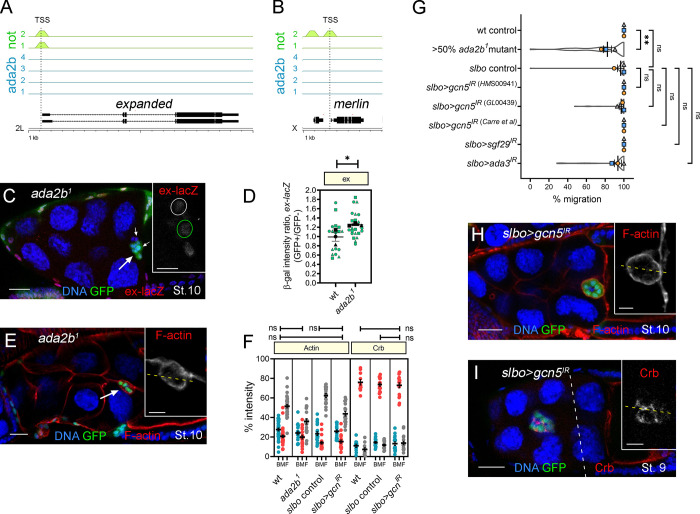
Figure 7.
Ex and Mer are targets of Not but not the HAT module of SAGA, which is dispensable for BC migration. (A and B) Not, but not Ada2b, binds to the ex and mer promoters. At the top are the ChIP-binding profiles for all replicates of Not (green; n = 2) and Ada2b (blue; n = 4) at ex and mer promoters in Drosophila embryos as determined from data reported in Li et al. (2017). Position of the transcription start site (TSS) is shown with a dotted line. Below is a schematic of the gene structure at the respective genomic loci with exons (thick lines) and introns (thin lines). Scale is in 1-kb intervals. (C) Confocal micrograph of a stage 10 egg chamber containing a BC cluster (arrow) with ada2b1 GFP-labeled MARCM clones (green) stained with antibodies against β-gal (red) to detect ex-lacZ expression. Inset shows ex-lacZ staining in grayscale, with mutant cells outlined (green dotted line). (D) Beeswarm plot showing a modest increase in ex-lacZ staining in ada2b1 mutant cells compared with sibling control cells; mean ± SEM of three repeats (n = 6 egg chambers/replicate). (E) Confocal micrograph of a stage 10 egg chamber (arrow) with ada2b1 GFP-labeled MARCM clone (green) stained with phalloidin to label F-actin (red), showing F-actin is localized to outer BC junctions as WT (compare with Fig 3 A). (F) Dot plots of Actin and Crb intensity for back, middle, and front (BMF) of the cluster derived from line scans taken from several egg chambers (n ≥ 3 egg chambers/replicate). (G) Plots showing overall mean migration ± SEM derived from means of each replicate (n ≥ 15 egg chambers) superimposed on violin plots showing distribution of the migration measurements for each of the indicated genotypes. (H and I) Confocal micrographs of egg chambers expressing slbo>gcn5IR in outer BCs (green) that have been stained for F-actin (H) or Crb (I) in red. Insets show F-actin and Crb staining; dashed yellow line indicates the position of line scans for quantitation (as in F). In all images, nuclei are labeled with TO-PRO-3 (blue). Scale bars are 25 µm (insets, 10 µm). *, P < 0.05; **, P < 0.01 by unpaired two-tailed Student’s t test. St., stage.

