Figure S1.
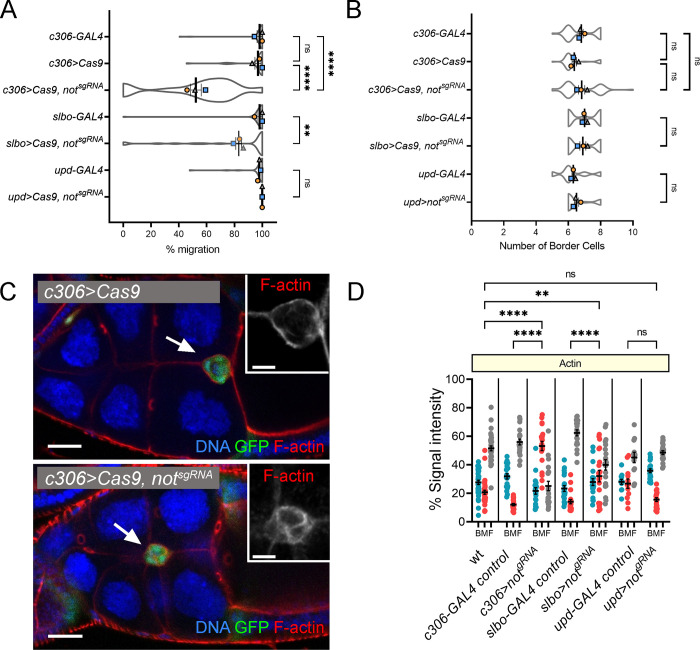
Effects of targeting not in the BC cluster with CRISPR-Cas9. (A) SuperPlot showing mean migration ± SEM derived from means of each replicate superimposed on violin plots of migration measurements for each of the indicated genotypes. Replicate trials consisted of n ≥ 12 egg chambers for each genotype. (B) Plots showing mean number of BCs ± SEM derived from means of each replicate superimposed on violin plots of measurements for each of the indicated genotypes. (C) Confocal micrographs of egg chambers with the BC cluster labeled with GFP in green (arrow) under the control of c306-GAL4. F-actin is in red; TO-PRO-3 (blue) stains all nuclei. A retarded BC cluster (arrow) upon CRISPR-Cas9 targeting of not (c306>Cas9, notsgRNA) shows disrupted F-actin polarity (see also insets). Scale bars in confocal images are 25 µm (insets, 10 µm). (D) Dot plot quantification of area under curve for back, middle, and front (BMF) of the BC cluster derived from line scans taken through the cluster. Error bars indicate SEM of replicates. **, P < 0.01; ****, P < 0.0001 by one-way ANOVA.

