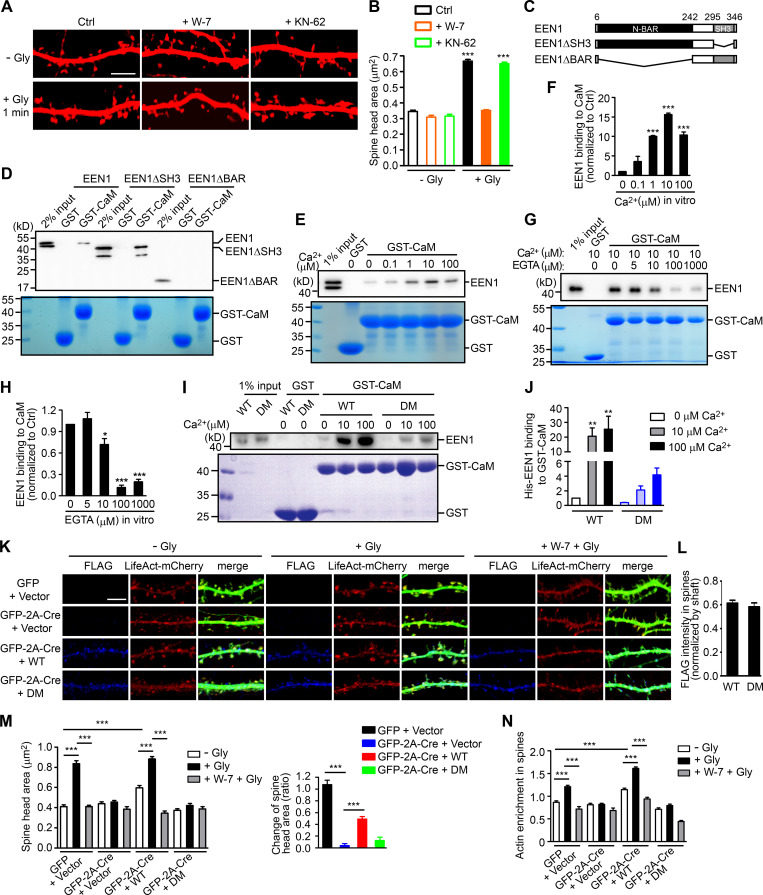
Figure 2.
Ca2+-dependent interaction between calmodulin and endophilin A1 is required for acute structural plasticity. (A) Effects of W-7 (calmodulin inhibitor) and KN-62 (CaMKII inhibitor) on spine enlargement 1 min after glycine application. Scale bar, 5 µm. (B) Quantification of spine size in A. Data are expressed as mean ± SEM for each group (control [Ctrl]: n = 12, n = 504 for − Gly; n = 14, n = 563 for + Gly. W-7: n = 13, n = 517 for − Gly; n = 18, n = 749 for + Gly; KN-62: n = 14, n = 526 for − Gly; n = 16, n = 661 for + Gly). P values were calculated using one-way ANOVA by Newman–Keuls post hoc test. ***, P < 0.0001. (C) Diagram showing the domain structure and fragments of endophilin A1 used in this study. (D) Binding of His-tagged endophilin A1 (EEN1) full-length, ΔSH3, and ΔBAR fragments to GST and calmodulin (CaM) in the GST pull-down assay. (E) Effect of Ca2+ on EEN1-CaM binding in the GST pull-down assay. (F) Quantification of EEN1 binding to calmodulin in E. n = 3 independent experiments. P values were calculated using one-way ANOVA by Newman–Keuls post hoc test. ***, P < 0.001 when compared with 0 µM Ca2+. (G) Effect of EGTA on EEN1-CaM binding in GST pull-down assay. (H) Quantification of EEN1-CaM binding in G. n = 5 independent experiments. P values were calculated using one-way ANOVA by Newman–Keuls post hoc test. *, P < 0.05; ***, P < 0.001 when compared with 0 µM EGTA. (I) Effect of Ca2+ on binding of EEN1 DM mutant to calmodulin in GST pull-down assay. (J) Quantification of EEN1 DM binding to calmodulin compared with WT in I. The y axis shows two segments. n = 4 independent experiments. P values were calculated using one-way ANOVA by Newman–Keuls post hoc test. **, P < 0.01 when compared with 0 µM Ca2+. (K) Cultured EEN1fl/fl hippocampal neurons cotransfected with LifeAct-mCherry, GFP or GFP-2A-Cre and FLAG vector, or LifeAct-mCherry, GFP-2A-Cre and FLAG-EEN1 WT or DM expression constructs on DIV12 were pretreated with DMSO or W-7 and induced cLTP on DIV16. Neurons were fixed 1 min after glycine application, immunostained for FLAG and imaged by confocal microscopy. Scale bar, 5 µm. (L) Spine/shaft distribution of EEN1 DM compared with WT. Data are expressed as mean ± SEM for each group (n = 11, n = 210 for WT; n = 10, n = 180 for DM). P values were calculated using two-tailed unpaired t test. (M) Quantification of spine size and changes in spine size in K. (N) Quantification of F-actin enrichment in spines in K. Data are expressed as mean ± SEM for each group in M and N (GFP + vector: n = 12, n = 230 for − Gly; n = 12, n = 223 for + Gly; n = 12, n = 246 for + W-7 + Gly. Cre + vector: n = 10, n = 187 for − Gly; n = 10, n = 183 for + Gly; n = 10, n = 181 for + W-7 + Gly. Cre + WT: n = 11, n = 210 for − Gly; n = 11, n = 209 for + Gly; n = 10, n = 189 for + W-7 + Gly. Cre + DM: n = 10, n = 180 for − Gly; n = 10, n = 187 for + Gly; n = 10, n = 192 for + W-7 + Gly). P values were calculated using one-way ANOVA by Newman–Keuls post hoc test. ***, P < 0.001.

