Figure 3.
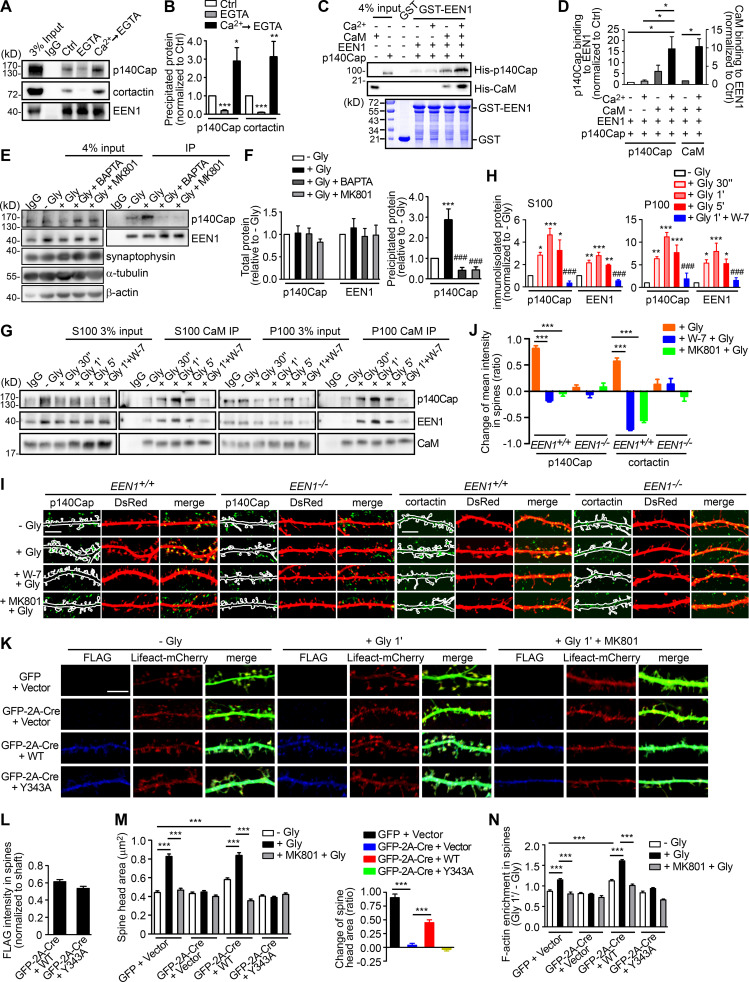
Ca2+/calmodulin promotes rapid spine enlargement via the endophilin A1-p140Cap pathway. (A) Effect of EGTA or Ca2+ on binding of EEN1 to p140Cap and cortactin. Endogenous immunoprecipitation assay was performed from mouse brain lysates with antibodies to EEN1. To mimic a transient increase in intracellular Ca2+, CaCl2 (1 mM) was added to lysates for 10 min on ice, followed by incubation with EGTA (1 mM) to chelate Ca2+ (Ca2+→EGTA). Lysates only (Ctrl) and lysates with EGTA serve as negative control. (B) Quantification of EEN1 binding to p140Cap and cortactin in A. n = 5 independent experiments. P values were calculated using one-way ANOVA by Newman–Keuls post hoc test. *, P < 0.05; **, P < 0.01; ***, P < 0.001 when compared with Ctrl. (C) Effect of Ca2+/calmodulin on EEN1-p140Cap binding in GST pull-down assay. (D) Quantification of p140Cap and calmodulin binding to EEN1 in C. n = 3 independent experiments. P values were calculated using one-way ANOVA by Newman–Keuls post hoc test. *, P < 0.05. (E) Effect of BAPTA or MK801 on EEN1-p140Cap binding in neurons upon cLTP induction. (F) Total protein levels of EEN1 and p140Cap and quantification of EEN1-p140Cap binding in E. n = 5 independent experiments. P values were calculated using one-way ANOVA by Newman–Keuls post hoc test. ***, P < 0.001 when compared with − Gly; ###, P < 0.001 when compared with + Gly 1 min. (G) Effect of W-7 on interactions between calmodulin and EEN1/p140Cap upon cLTP induction. DIV16 neurons were collected, and the cytosolic (S100) and membrane (P100) fractions were used for immunoisolation with antibodies to calmodulin. (H) Quantification of EEN1 and p140Cap immunoisolated by anti-calmodulin in G. n = 5 independent experiments. P values were calculated using one-way ANOVA by Newman–Keuls post hoc test. *, P < 0.05; **, P < 0.01; ***, P < 0.001 when compared with − Gly; ###, P < 0.001 when compared with + Gly 1 min. (I) Neurons expressing DsRed were pretreated with DMSO, W-7, or MK801 and induced cLTP on DIV16 with glycine for 1 min, and immunostained for p140Cap or cortactin (green) and imaged by confocal microscopy. Scale bars, 5 µm. (J) Quantification of changes in p140Cap and cortactin signal intensities in spines compared with the control (− Gly) group in I. Data are expressed as mean ± SEM for each group. For p140Cap, EEN1+/+: n = 11, n = 431 for − Gly; n = 15, n = 482 for + Gly; n = 14, n = 437 for + W-7 + Gly; n = 14, n = 429 for + MK801 + Gly; EEN−/−: n = 12, n = 447 for − Gly; n = 14, n = 473 for + Gly; n = 14, n = 448 for + W-7 + Gly; n = 14, n = 445 for + MK801 + Gly. For cortactin, EEN1+/+: n = 12, n = 446 for − Gly; n = 15, n = 474 for + Gly; n = 14, n = 451 for + W-7 + Gly; n = 14, n = 443 for + MK801 + Gly; EEN−/−: n = 14, n = 456 for − Gly; n = 15, n = 473 for + Gly; n = 14, n = 464 for + W-7 + Gly; n = 13, n = 435 for + MK801 + Gly). P values were calculated using one-way ANOVA by Newman–Keuls post hoc test. ***, P < 0.001. (K) Cultured EEN1fl/fl hippocampal neurons cotransfected with LifeAct-mCherry, GFP or GFP-2A-Cre and FLAG vector, or LifeAct-mCherry, GFP-2A-Cre, and FLAG-EEN1 WT or Y343A expression constructs on DIV12 were pretreated with DMSO or MK801 and induced cLTP on DIV16. Neurons were fixed 1 min after glycine application, immunostained for FLAG, and imaged by confocal microscopy. Scale bar, 5 µm. (L) Spine/shaft distribution of EEN1 Y343A compared with WT. Data are expressed as mean ± SEM for each group (n = 10, n = 202 for Cre + WT; n = 10, n = 190 for Cre + Y343A). P values were calculated using two-tailed unpaired t test. (M) Quantification of spine size and changes in spine size in K. (N) Quantification of F-actin enrichment in spines in K. Data are expressed as mean ± SEM for each group in M and N (GFP + vector: n = 11, n = 205 for − Gly; n = 11, n = 213 for + Gly; n = 11, n = 227 for + MK801 + Gly. Cre + Vector: n = 11, n = 197 for − Gly; n = 11, n = 194 for + Gly; n = 11, n = 195 for + MK801 + Gly; Cre + WT: n = 10, n = 202 for − Gly; n = 11, n = 226 for + Gly; n = 10, n = 193 for + MK801 + Gly; Cre + Y343A: n = 10, n = 190 for − Gly; n = 11, n = 207 for + Gly; n = 10, n = 196 for + MK801 + Gly). P values were calculated using one-way ANOVA by Newman–Keuls post hoc test. ***, P < 0.001.

