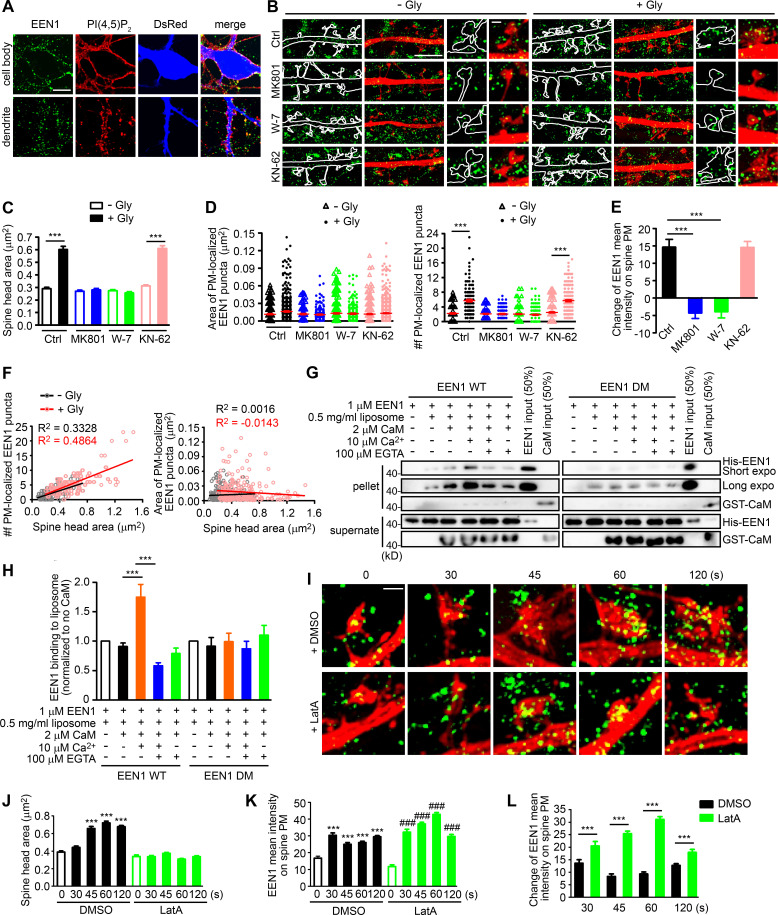
Figure 4.
Ca2+/calmodulin-enhanced PM association of endophilin A1 correlates with spine expansion. (A) Detection of PM-localized endophilin A1. DIV16 hippocampal neurons were immunostained for PM-localized EEN1 and PI(4,5)P2 (+ control). The volume marker DsRed is pseudocolored blue. Scale bar, 10 µm. (B) DIV16 neurons expressing DsRed were pretreated with DMSO, MK801, W-7, or KN-62 and induced cLTP with glycine for 1 min, immunostained for PM-localized EEN1 (green), and imaged by 3D-SIM. Scale bars represent 4 µm in the left and center panels and 500 nm in magnified images in the right panels. (C) Quantification of spine size in B. (D) Quantification of the area and number of individual spine PM-localized EEN1 puncta in B. Data are expressed as mean ± SEM or plotted along with mean ± SEM for each group in C and D (Ctrl: n = 12, n = 278 for − Gly; n = 11, n = 254 for + Gly; MK801: n = 12, n = 256 for − Gly; n = 12, n = 263 for + Gly; W-7: n = 13, n = 295 for − Gly; n = 10, n = 278 for + Gly; KN-62: n = 13, n = 317 for − Gly; n = 12, n = 268 for + Gly). P values were calculated using one-way ANOVA by Newman–Keuls post hoc test. ***, P < 0.001. (E) Quantification of changes in the amount of spine PM-localized EEN1 in B. Data are expressed as mean ± SEM for each group (n = 11, n = 254 for Ctrl + Gly; n = 12, n = 263 for MK801 + Gly; n = 10, n = 278 for W-7 + Gly; n = 12, n = 268 for KN-62 + Gly). P values were calculated using one-way ANOVA by Newman–Keuls post hoc test. ***, P < 0.001. (F) Scatterplot of the number or area of PM-localized EEN1 puncta versus the size of spine head for control (− Gly, n = 278 spines) and cLTP (+ Gly, n = 254 spines) groups with linear fits using linear regression analysis. (G) Effect of Ca2+/calmodulin on binding of EEN1 WT or DM protein to curved membrane in liposome (50 nm in diameter) cosedimentation assay. (H) Quantification of EEN1 binding to liposome in F. n = 7 independent experiments. P values were calculated using one-way ANOVA by Newman–Keuls post hoc test. ***, P < 0.001. (I) DIV16 neurons were pretreated with DMSO or LatA, and cLTP was performed. Cells were fixed at 30, 45, 60, or 120 s after glycine application. PM-localized EEN1 was stained and imaged by 3D-SIM. Scale bar, 500 nm. (J) Quantification of spine size in I. (K) Quantification of spine PM-localized EEN1 in I. (L) Quantification of changes in the amount of spine PM-localized EEN1 in I. Data are expressed as mean ± SEM for each group in J–L (DMSO: n = 10, n = 241 for 0 s; n = 11, n = 246 for 30 s; n = 11, n = 252 for 45 s; n = 14, n = 360 for 60 s; n = 14, n = 358 for 120 s; LatA: n = 10, n = 254 for 0 s; n = 11, n = 269 for 30 s; n = 14, n = 368 for 45 s; n = 15, n = 407 for 60 s; n = 14, n = 306 for 120 s). P values were calculated using one-way ANOVA by Newman–Keuls post hoc test. ***, P < 0.001 when compared with DMSO 0 s; ###, P < 0.001 when compared with LatA 0 s in J and K. ***, P < 0.001 in L.

