Figure 6.
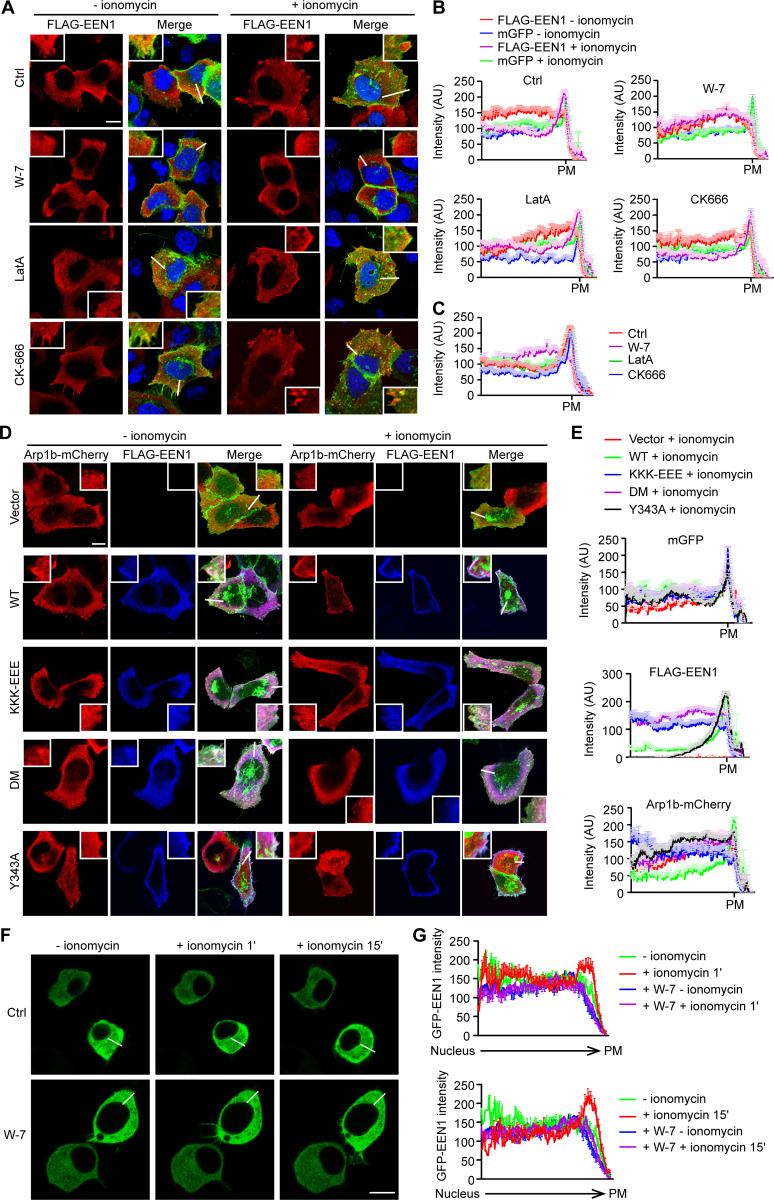
In response to Ca2+/calmodulin, endophilin A1 associates with the PM and recruits Arp2/3 via p140Cap. (A) HeLa cells were cotransfected with constructs expressing mGFP, myc-p140Cap, and FLAG-EEN1 for 24 h; preincubated with DMSO, W-7, LatA, or CK-666 for 30 min; treated with ionomycin for 20 min; and immunostained for FLAG for confocal microscopy. Shown are representative images. Magnified images are shown in white boxes. Scale bar, 10 µm. (B) Quantification of subcellular distribution of FLAG-EEN1 and mGFP in cells by linescan plots of the fluorescence intensity along the white lines indicated in the images in A. AU, arbitrary units. Ctrl: n = 34 for − ionomycin, n = 39 for + ionomycin; W-7: n = 35 for − ionomycin, n = 38 for + ionomycin; LatA: n = 30 for − ionomycin, n = 34 for + ionomycin; CK666: n = 34 for − ionomycin, n = 39 for + ionomycin. (C) Quantification of FLAG-EEN1 distribution in ionomycin-treated cells in B. n = 39 for Ctrl, n = 38 for W-7, n = 34 for LatA, n = 39 for CK666. (D) HeLa cells were cotransfected with constructs expressing mGFP, myc-p140Cap, Arp1b-mCherry and FLAG-EEN1 WT, Y343A, KKK-EEE, or DM for 24 h, treated with ionomycin for 20 min, and immunostained for FLAG for confocal microscopy. Scale bar, 10 µm. (E) Quantification of subcellular distribution of mGFP, FLAG-EEN1 and Arp1b-mCherry in cells in D. n = 32 for vector, n = 31 for WT, n = 31 for KKK-EEE, n = 32 for DM, and n = 31 for Y343A. (F) Neuro-2a cells expressing EGFP-EEN1 were imaged live by confocal microscopy before and after ionomycin application. Shown are still images of Neuro-2a cells at 0, 1, and 15 min of ionomycin treatment. (G) Quantification of EGFP-EEN1 distribution by linescan plots of fluorescence intensity along the white lines indicated in the images in F. Ctrl: 9 cells; W-7: 11 cells. Scale bar, 10 µm.

