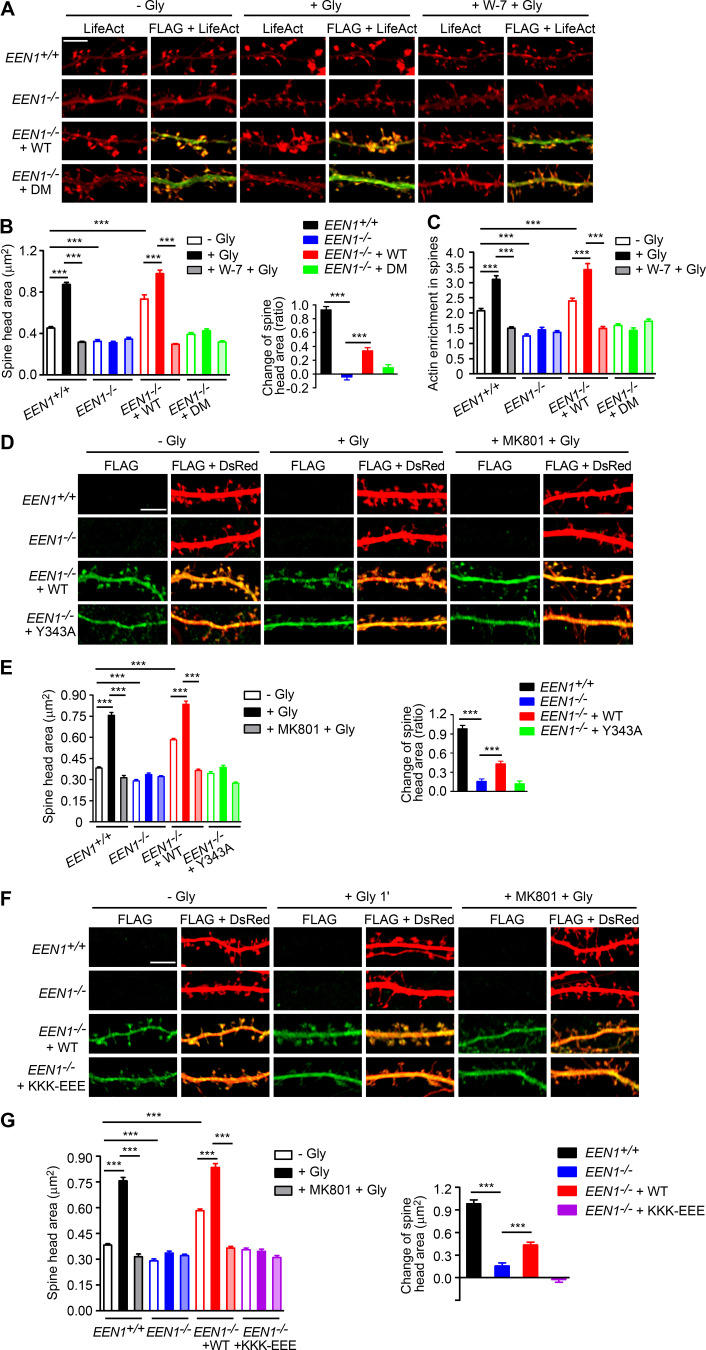
Figure S4.
Rescue of acute sLTP in EEN1 KO neurons by EEN1 mutants. (A) Cultured EEN1+/+ and EEN1−/− hippocampal neurons cotransfected with LifeAct-mCherry and FLAG vector and EEN1−/− hippocampal neurons cotransfected with LifeAct-mCherry and FLAG-EEN1 WT or DM on DIV12 were pretreated with DMSO or W-7 and induced cLTP on DIV16. Neurons were fixed 1 min after glycine application and imaged by confocal microscopy. Scale bar, 5 µm. (B) Quantification of spine size and changes in spine size in A. (C) Quantification of F-actin enrichment in spines in A. Data are expressed as mean ± SEM for each group in B and C (EEN1+/+: n = 12, n = 472 for − Gly; n = 12, n = 483 for + Gly; n = 12, n = 450 for + W-7 + Gly; EEN1−/−: n = 12, n = 458 for − Gly; n = 12, n = 464 for + Gly; n = 12, n = 461 for + W-7 + Gly; EEN1−/− + WT: n = 12, n = 475 for − Gly; n = 12, n = 466 for + Gly; n = 12, n = 453 for + W-7 + Gly; EEN1−/− + DM: n = 12, n = 467 for − Gly; n = 13, n = 487 for + Gly; n = 12, n = 456 for + W-7 + Gly). P values were calculated using one-way ANOVA by Newman–Keuls post hoc test. ***, P < 0.001. (D) Cultured EEN1+/+ and EEN1−/− hippocampal neurons cotransfected with pLL3.7-DsRed and FLAG vector and EEN1−/− hippocampal neurons cotransfected with pLL3.7-DsRed and FLAG-EEN1 WT or Y343A on DIV12 were pretreated with DMSO or MK801 and induced cLTP on DIV16. Neurons were fixed 1 min after glycine application and imaged by confocal microscopy. Scale bar, 5 µm. (E) Quantification of spine size and changes in spine size in D. Data are expressed as mean ± SEM for each group (EEN1+/+: n = 15, n = 528 for − Gly; n = 15, n = 574 for + Gly; n = 14, n = 542 for + MK801 + Gly; EEN1−/−: n = 13, n = 522 for − Gly; n = 13, n = 564 for + Gly; n = 12, n = 502 for + MK801 + Gly; EEN1−/− + WT: n = 13, n = 515 for − Gly; n = 13, n = 526 for + Gly; n = 13, n = 523 for + MK801 + Gly; EEN1−/− + Y343A: n = 13, n = 527 for − Gly; n = 13, n = 512 for + Gly; n = 13, n = 504 for + MK801 + Gly). P values were calculated using one-way ANOVA by Newman–Keuls post hoc test. ***, P < 0.001. (F) Same as D, except that the mutant was KKK-EEE. Scale bar, 5 µm. (G) Quantification of spine size or changes in spine size in F. Data are expressed as mean ± SEM for each group (EEN1+/+: n = 15, n = 528 for − Gly; n = 15, n = 574 for + Gly; n = 14, n = 542 for + MK801 + Gly; EEN1−/−: n = 13, n = 522 for − Gly; n = 13, n = 564 for + Gly; n = 12, n = 502 for + MK801 + Gly; EEN1−/− + WT: n = 13, n = 515 for − Gly; n = 13, n = 526 for + Gly; n = 13, n = 523 for + MK801 + Gly; EEN1−/− + KKK-EEE: n = 12, n = 482 for − Gly; n = 12, n = 491 for + Gly; n = 12, n = 489 for + MK801 + Gly). P values were calculated using one-way ANOVA by Newman–Keuls post hoc test. ***, P < 0.001.

