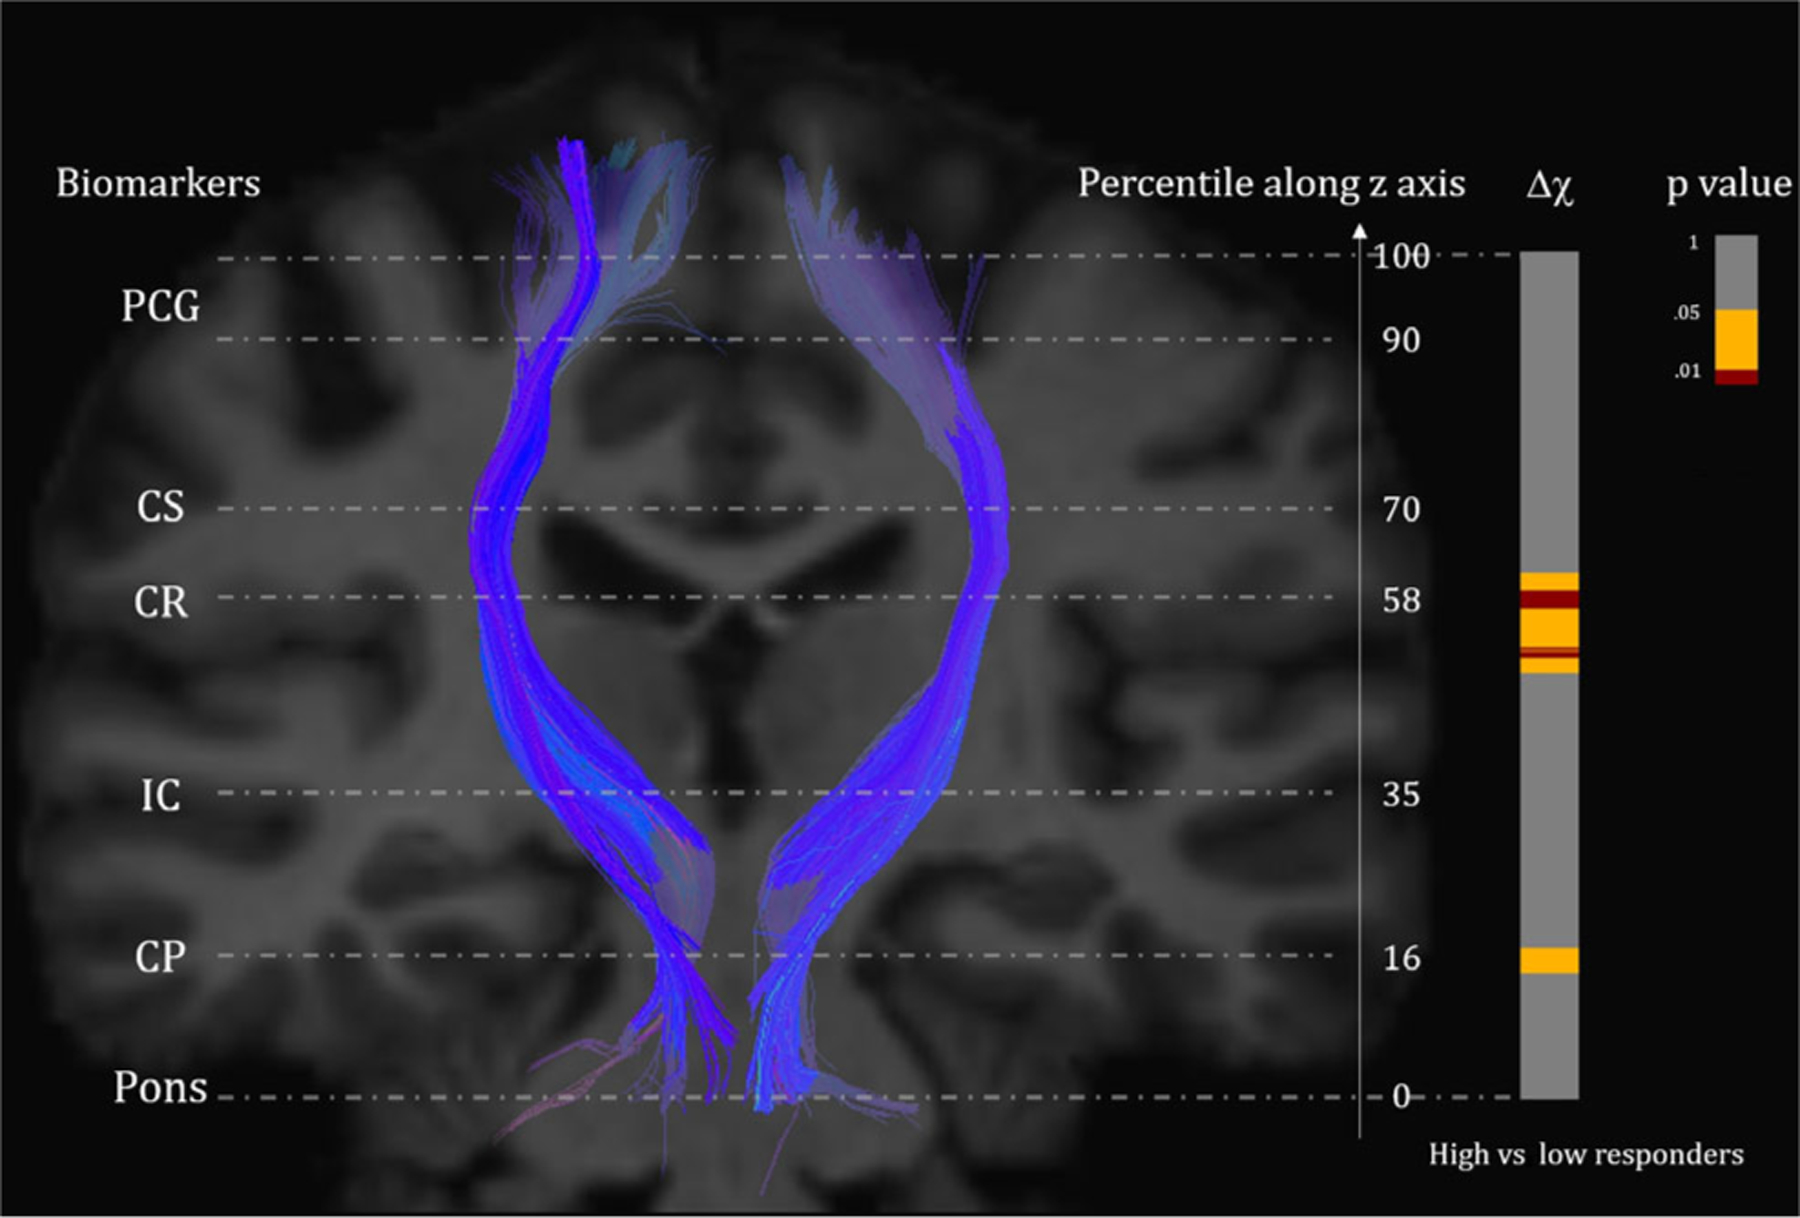
FIGURE 1:

Segments exhibiting significant changes of magnetic susceptibility (Δχ) between high vs. low responders, indicated by projections along a CST on the JHU-MNI-ss T1 template with P-values on the right. Red color in the projection corresponds to highly significant regions with P < 0.01 between the groups, yellow corresponds to regions with 0.01 ≤ P < 0.05, and gray indicates insignificant segments. Important anatomical landmarks (CP = cerebral peduncle, IC = internal capsule, CR = corona radiata, CS = centrum semiovale) are shown on the left, with the corresponding normalized z-axis coordinates shown on the right.
