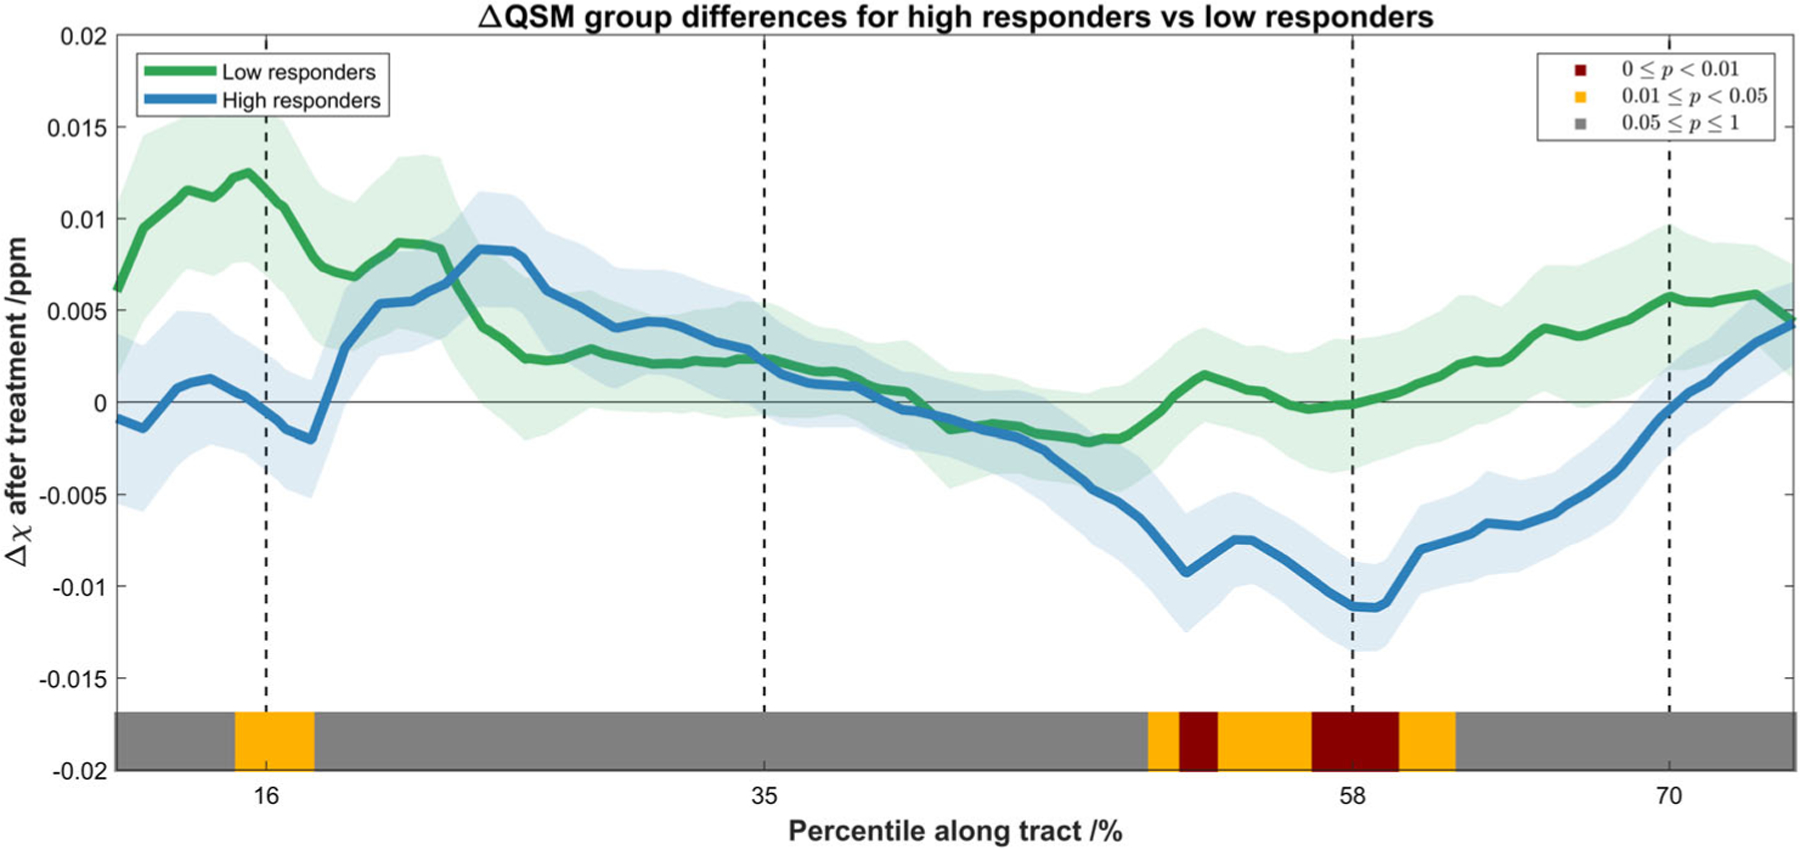
FIGURE 2:

Spatial profile of the Δχ after the treatment along the CST for low responders (green) and high responders (blue), shown in mean ± standard error. The statistical significance of the difference between the two groups is indicated by the color bar (the same scheme as in Fig. 1). Subjects with more substantial motor function improvements exhibit more diamagnetic susceptibility change after treatment, and this significant difference was mostly located at the periventricular regions of the CST (from the internal capsule to the centrum semiovale).
