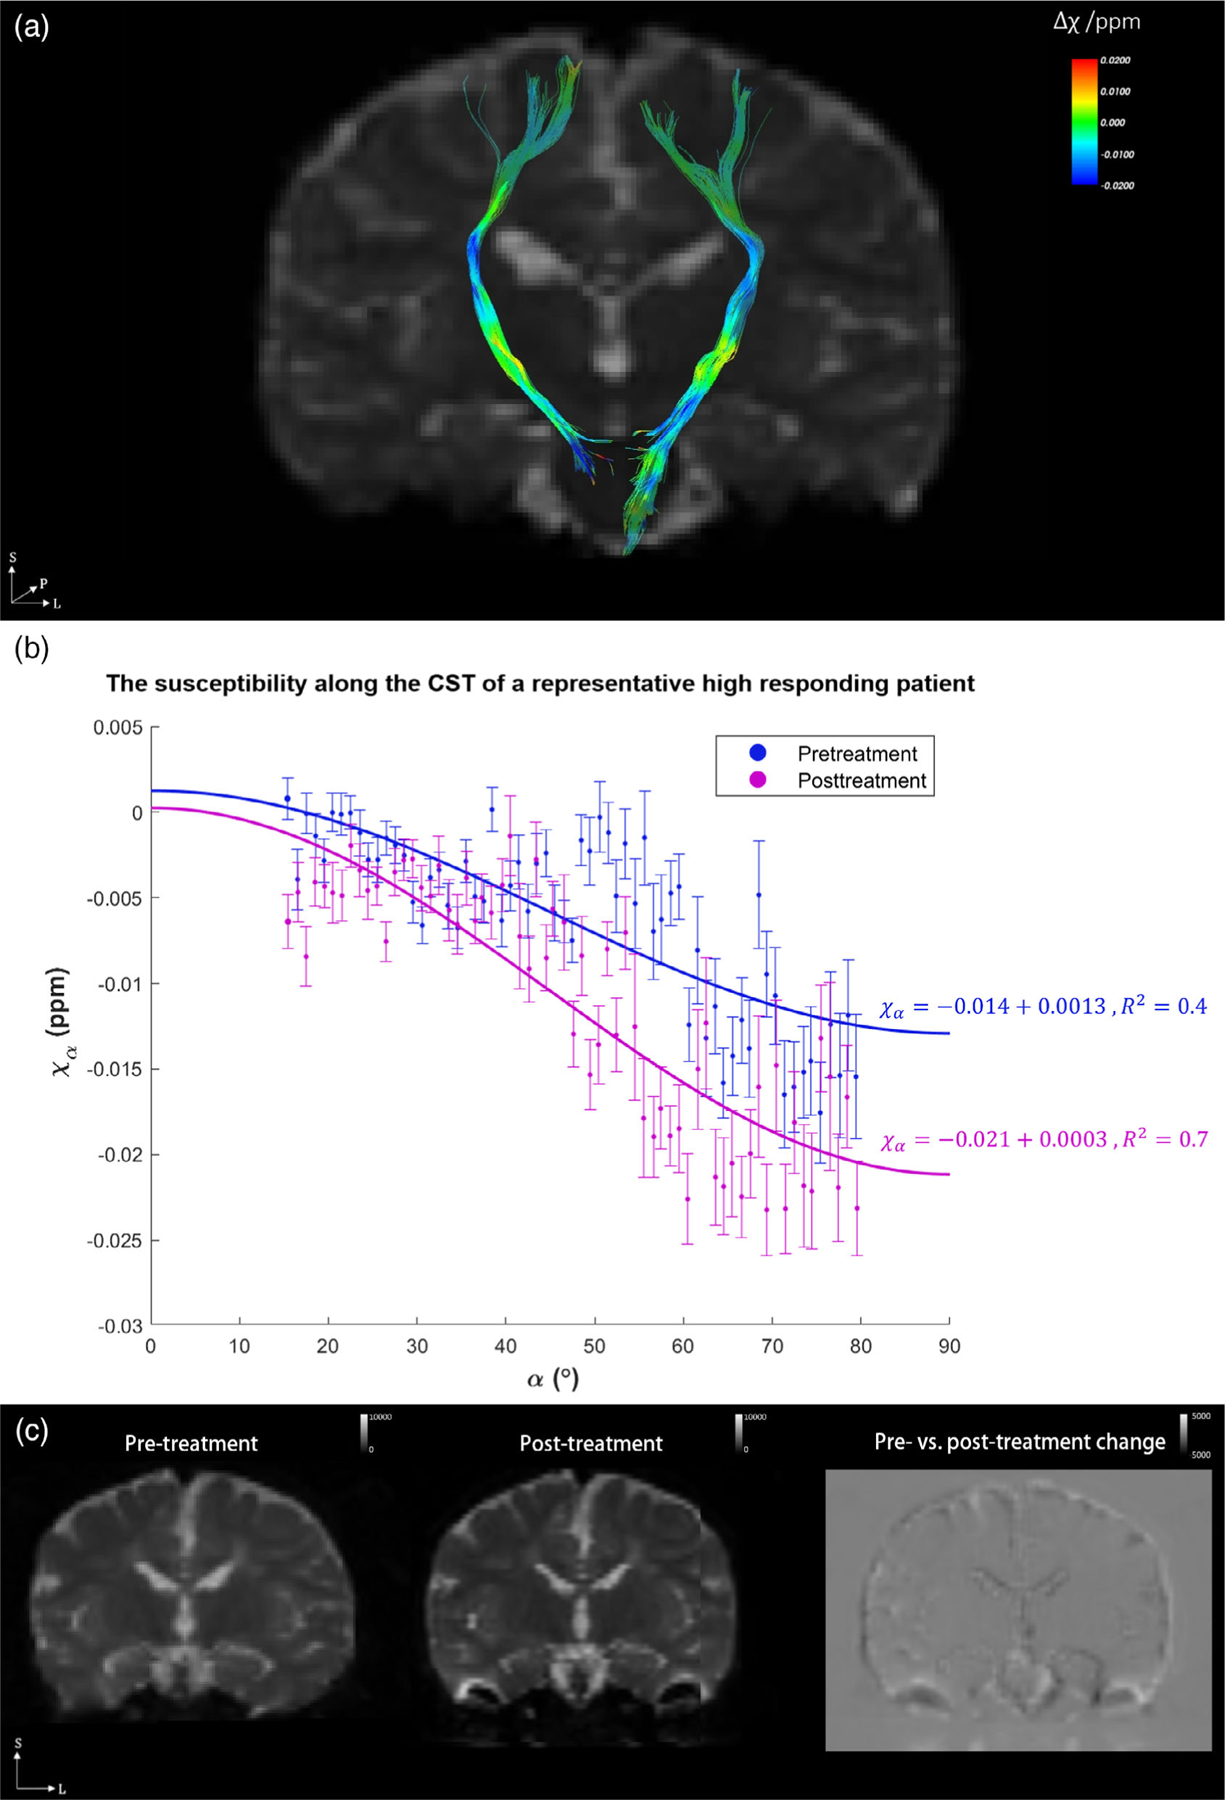
FIGURE 3:

(a) The magnetic susceptibility change after treatment (Δχ) overlaid onto the CST of a representative high-responding subject; (b) the angle dependence of pre- and posttreatment magnetic susceptibility values along the CST; and (c) the pre- and posttreatment T2-weighted images of the subject, with the difference image shown on the right illustrating minimal changes in the CST. In (b), blue points correspond to the pretreatment magnetic susceptibilities of the subject, and purple points are those posttreatment. All data points are fitted into 1° angle increments, shown in mean ± standard error. The angles between the principle eigenvector of the diffusion tensor and the B0 field are shown in the horizontal axis; for example, 0° means that the fiber pathway is parallel to the main magnetic field. The fitted MSA values for pre- and posttreatment are −0.014 ± 0.001 and −0.021 ± 0.002 (mean ± standard error, estimated at 95% confidence interval), respectively. The ΔMSA for this high responding subject is −0.007 (more diamagnetic) after treatment.
