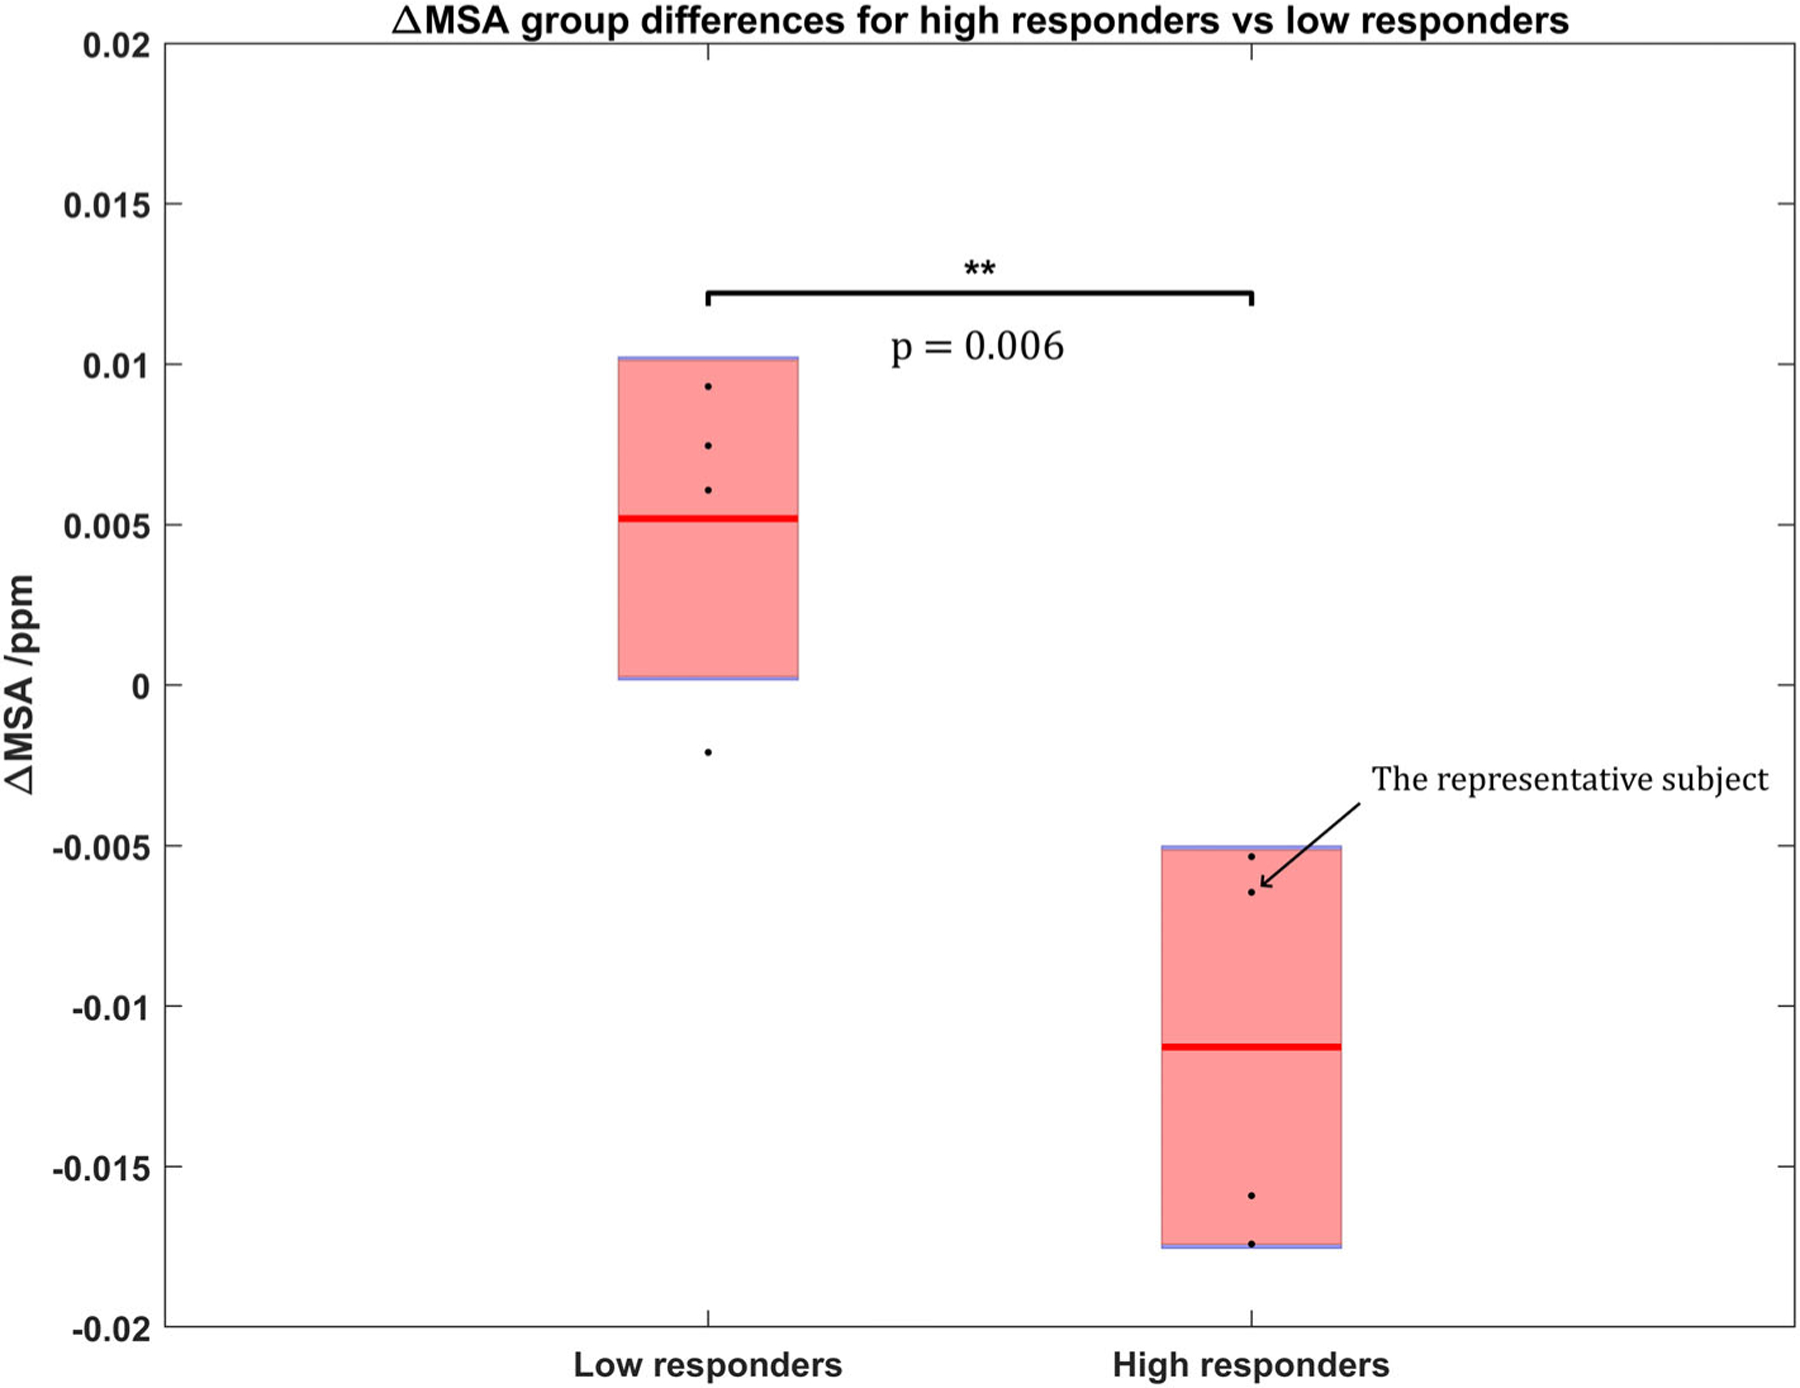
FIGURE 4:

Group comparison of the ΔMSA after treatment between high and low responders. ΔMSA for each individual subject (black points), along with the group mean ΔMSA (red line) and the standard error (pink rectangle) are plotted. The MSA has turned significantly more diamagnetic (P = 0.006) for high-responding subjects compared to those exhibiting lower motor function improvements.
