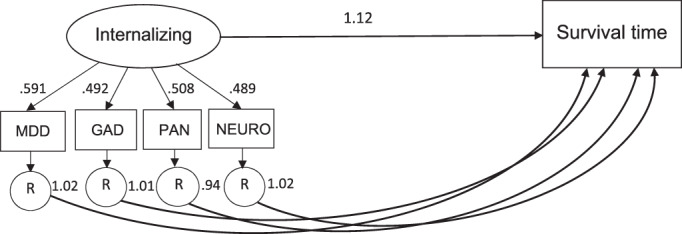
Figure 1.

Comparative predictive validity analysis. Arrows flowing from the latent internalizing factor to its indicators represent factor loadings, which were all statistically significant at p<0.001. The arrow leading from internalizing to survival time represents the hazard ratio of the Cox regression model, which was significant at p<0.01. Arrows leading from each of the residual variance to survival time represent the hazard ratios of each Cox regression model, which were all non‐significant. MDD – major depressive disorder, GAD – generalized anxiety disorder, PAN – panic disorder, NEURO – neuroticism, R = residual variance.
