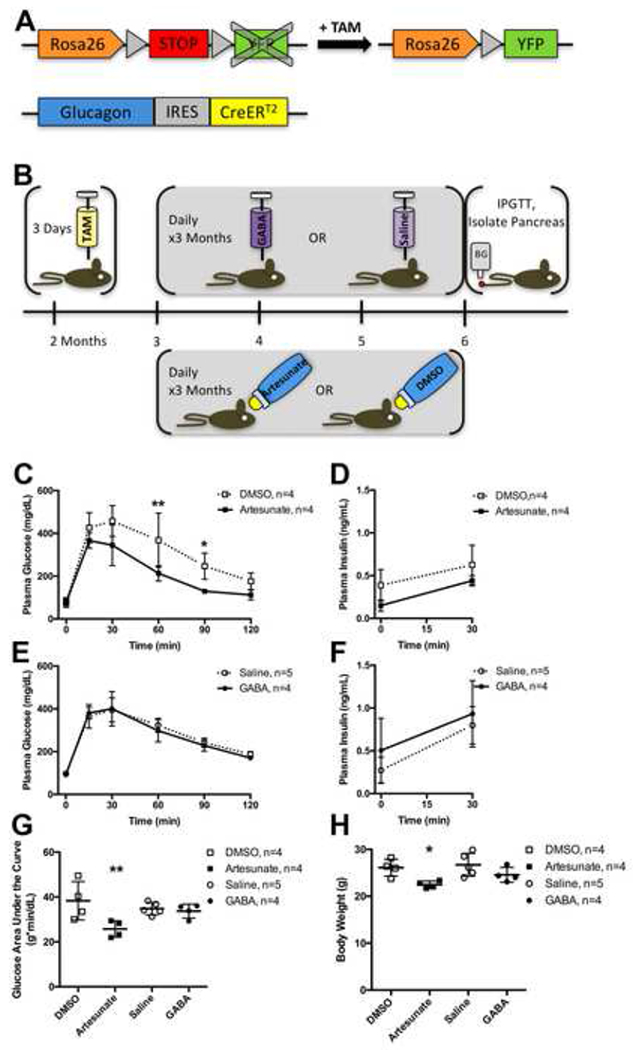
Figure 1. Experimental Design, Glucose Tolerance and Body Weight After Treatment with Artesunate or GABA.

(A) Glucagon-CreERT2;Rosa-LSL-eYFP/+ mice were treated with tamoxifen (TAM) to induce Cre-mediated recombination of the floxed STOP cassette in the Rosa26 locus, resulting in YFP expression in α cells.
(B) 2 month old male mice were injected with TAM daily for 3 days, then 1 month later were treated with either daily injections of GABA or saline vehicle, or with artesunate or DMSO vehicle in the drinking water, for 3 months, then the mice underwent fasting intraperitoneal glucose tolerance test (IPGTT) and were killed for pancreas isolation.
(C) Plasma glucose concentrations during fasting intraperitoneal glucose tolerance test (IPGTT) in Glucagon-CreERT2;Rosa-LSL-eYFP/+ male mice performed at end of experimental timeline, 6 months of age, after treatment with artesunate (solid line with filled squares) or DMSO vehicle (dotted line with open squares). See also Figure S2.
(D) Plasma insulin concentrations during fasting IPGTT after treatment with artesunate or DMSO vehicle.
(E) Plasma glucose concentrations during fasting IPGTT after treatment with GABA (solid line with filled circles) or saline vehicle (dotted line with open circles).
(F) Plasma insulin concentrations during fasting IPGTT after treatment with GABA or saline vehicle.
(G) Plasma glucose concentration area under the curve during IPGTT.
(H) Body weight at time of IPGTT.
Data are presented as mean ± standard deviation. Data points from individual mice are presented in (G-H). * represents P < 0.05 and ** represents P < 0.01 by t-test with Holm-Sidak correction for multiple comparisons (C-F) or by one-way ANOVA with Sidak correction for multiple comparisons (G-H).
