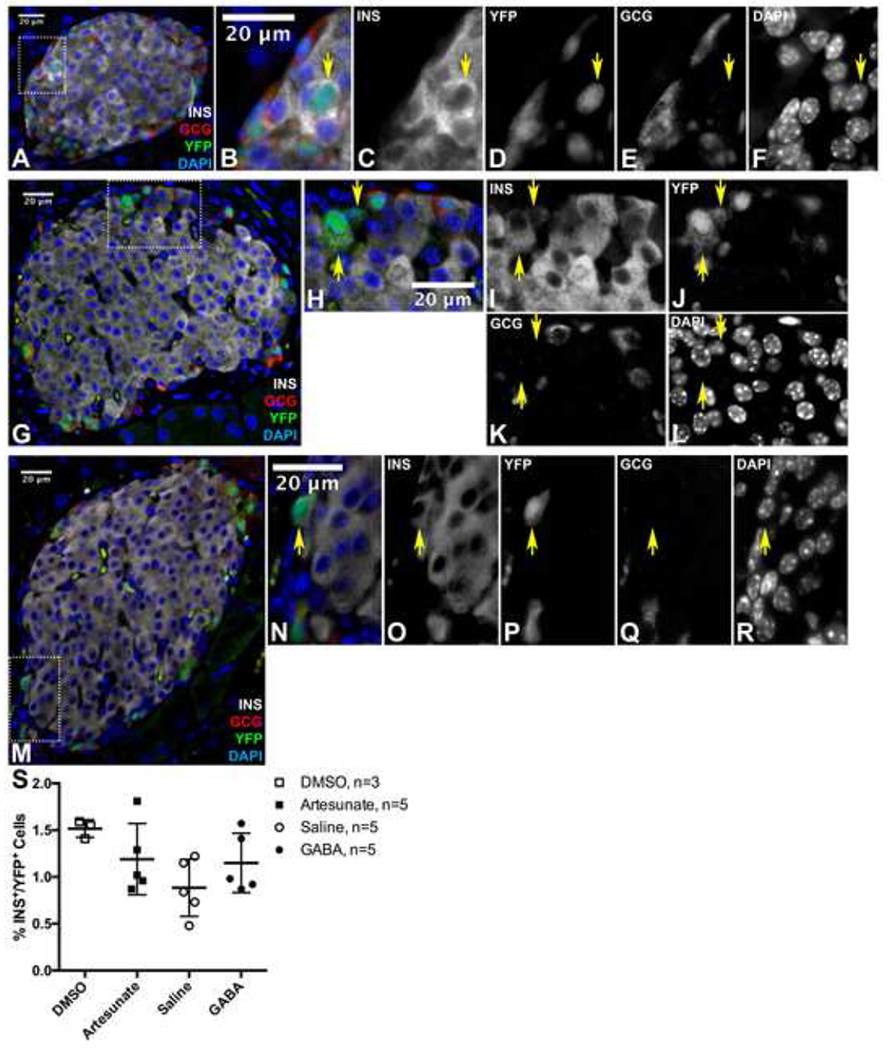
Figure 2. No Lineage Tracing Evidence of α-to-β Cell Trans-differentiation After Artesunate or GABA Treatment.

(A) Representative immunofluorescent image of islet from a saline-treated mouse.
(B-F) are magnified view of area outlined in (A).
(G) Representative immunofluorescent image of islet from a GABA-treated mouse.
(H-L) are magnified view of area outlined in (G).
(M) Representative immunofluorescent image of islet from an artesunate-treated mouse.
(N-R) are magnified view of area outlined in (M).
Yellow arrows indicate Insulin+/YFP+ cells. Scale bars represent 20 μm. INS = Insulin, GCG = Glucagon
(S) Quantification of % YFP+ cells that are also lnsulin+, as depicted in (A-M). Data points from individual mice are presented with mean ± standard deviation. No significant differences were detected by one-way ANOVA with Sidak correction for multiple comparisons.
