
Fig. 2.
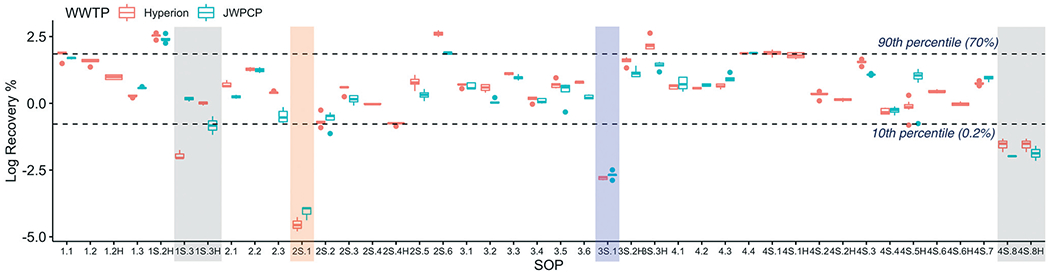
Log-transformed OC43 recovery efficiency at Plant 1 (Hyperion) and Plant 2 (JWPCP), measured by each SOP. The SARS-CoV-2 results from the SOPs highlighted are not represented in Fig. 1 due to the fact that the results were all non-detect (gray), the recovery was below the quality control cut-off of 0.01% (blue), or both (orange).