
Fig. 3.
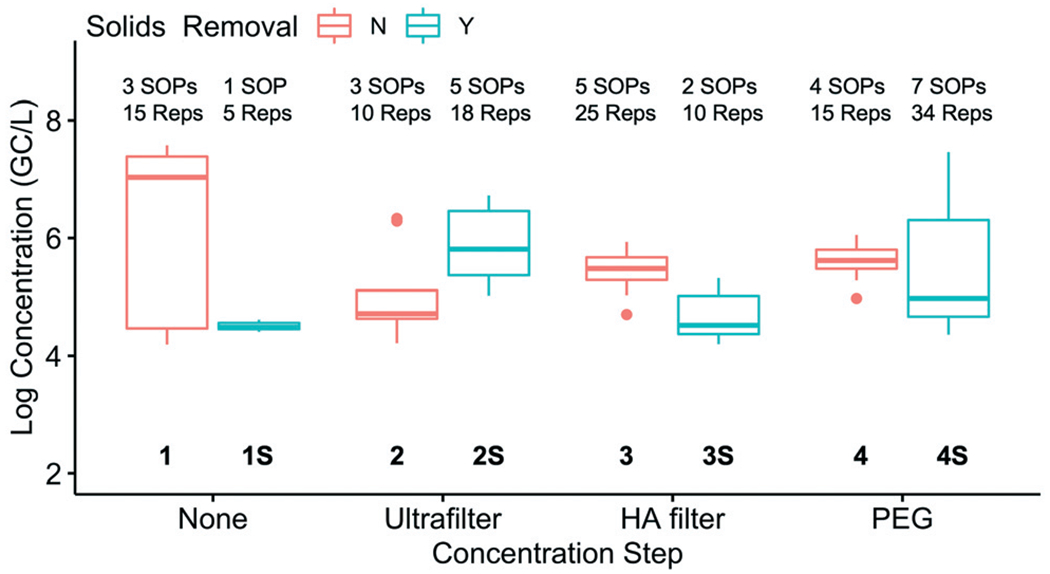
Comparison of the log-transformed SARS-CoV-2 (N1) concentrations at Plant 1 measured by each of the eight method groups (grouped by concentration step and solids removal). The number of SOPs and total sample replicates included in each method group are shown at the top of the box plot.